See what your server is running right now
On Pro, the cluster monitor shows live metrics and replica set health, and lists the running operations with the plan each chose and a Kill button. Indexes, validation rules and the operation log are on every tier.
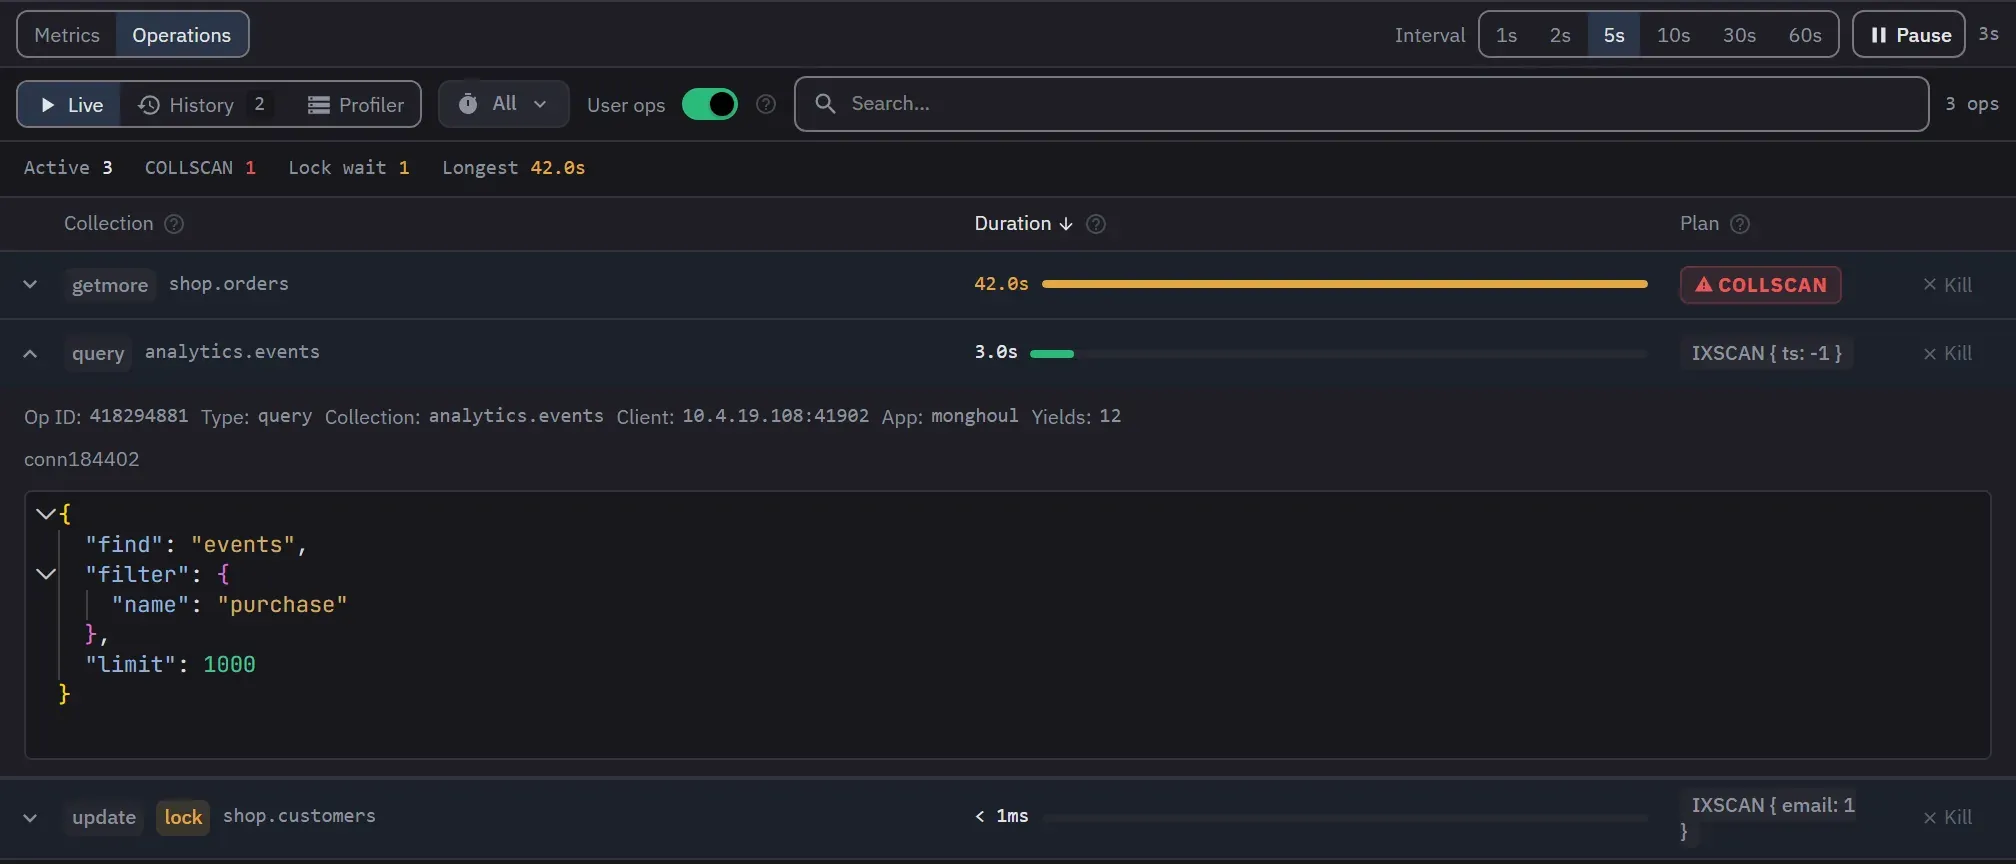
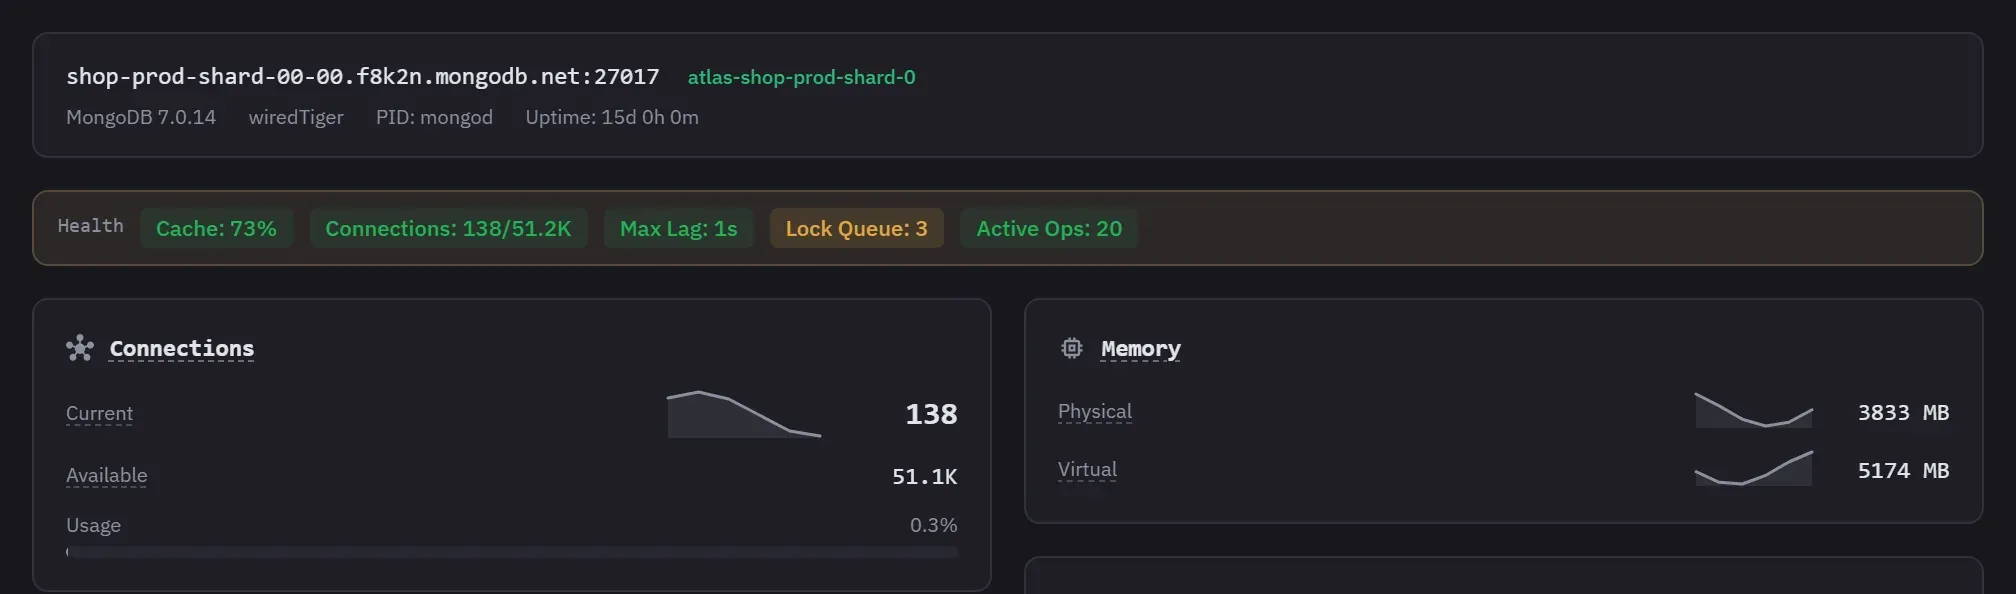
Live metrics and health
On Pro, one health line for the cache, connections, replication lag and lock queues, then each metric as a live number with its sparkline: connections, memory, operations, network and documents per second.
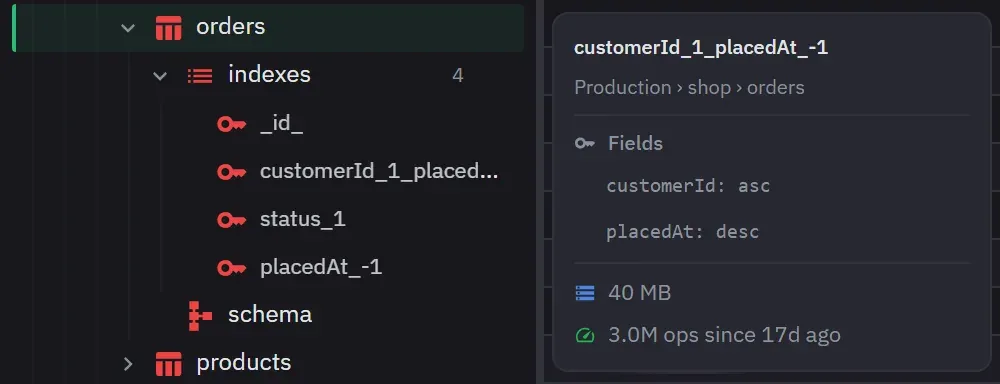
How much each index is used
Point at an index to see its keys, its size, and how many operations used it since the server started counting. Some deployments do not report it.
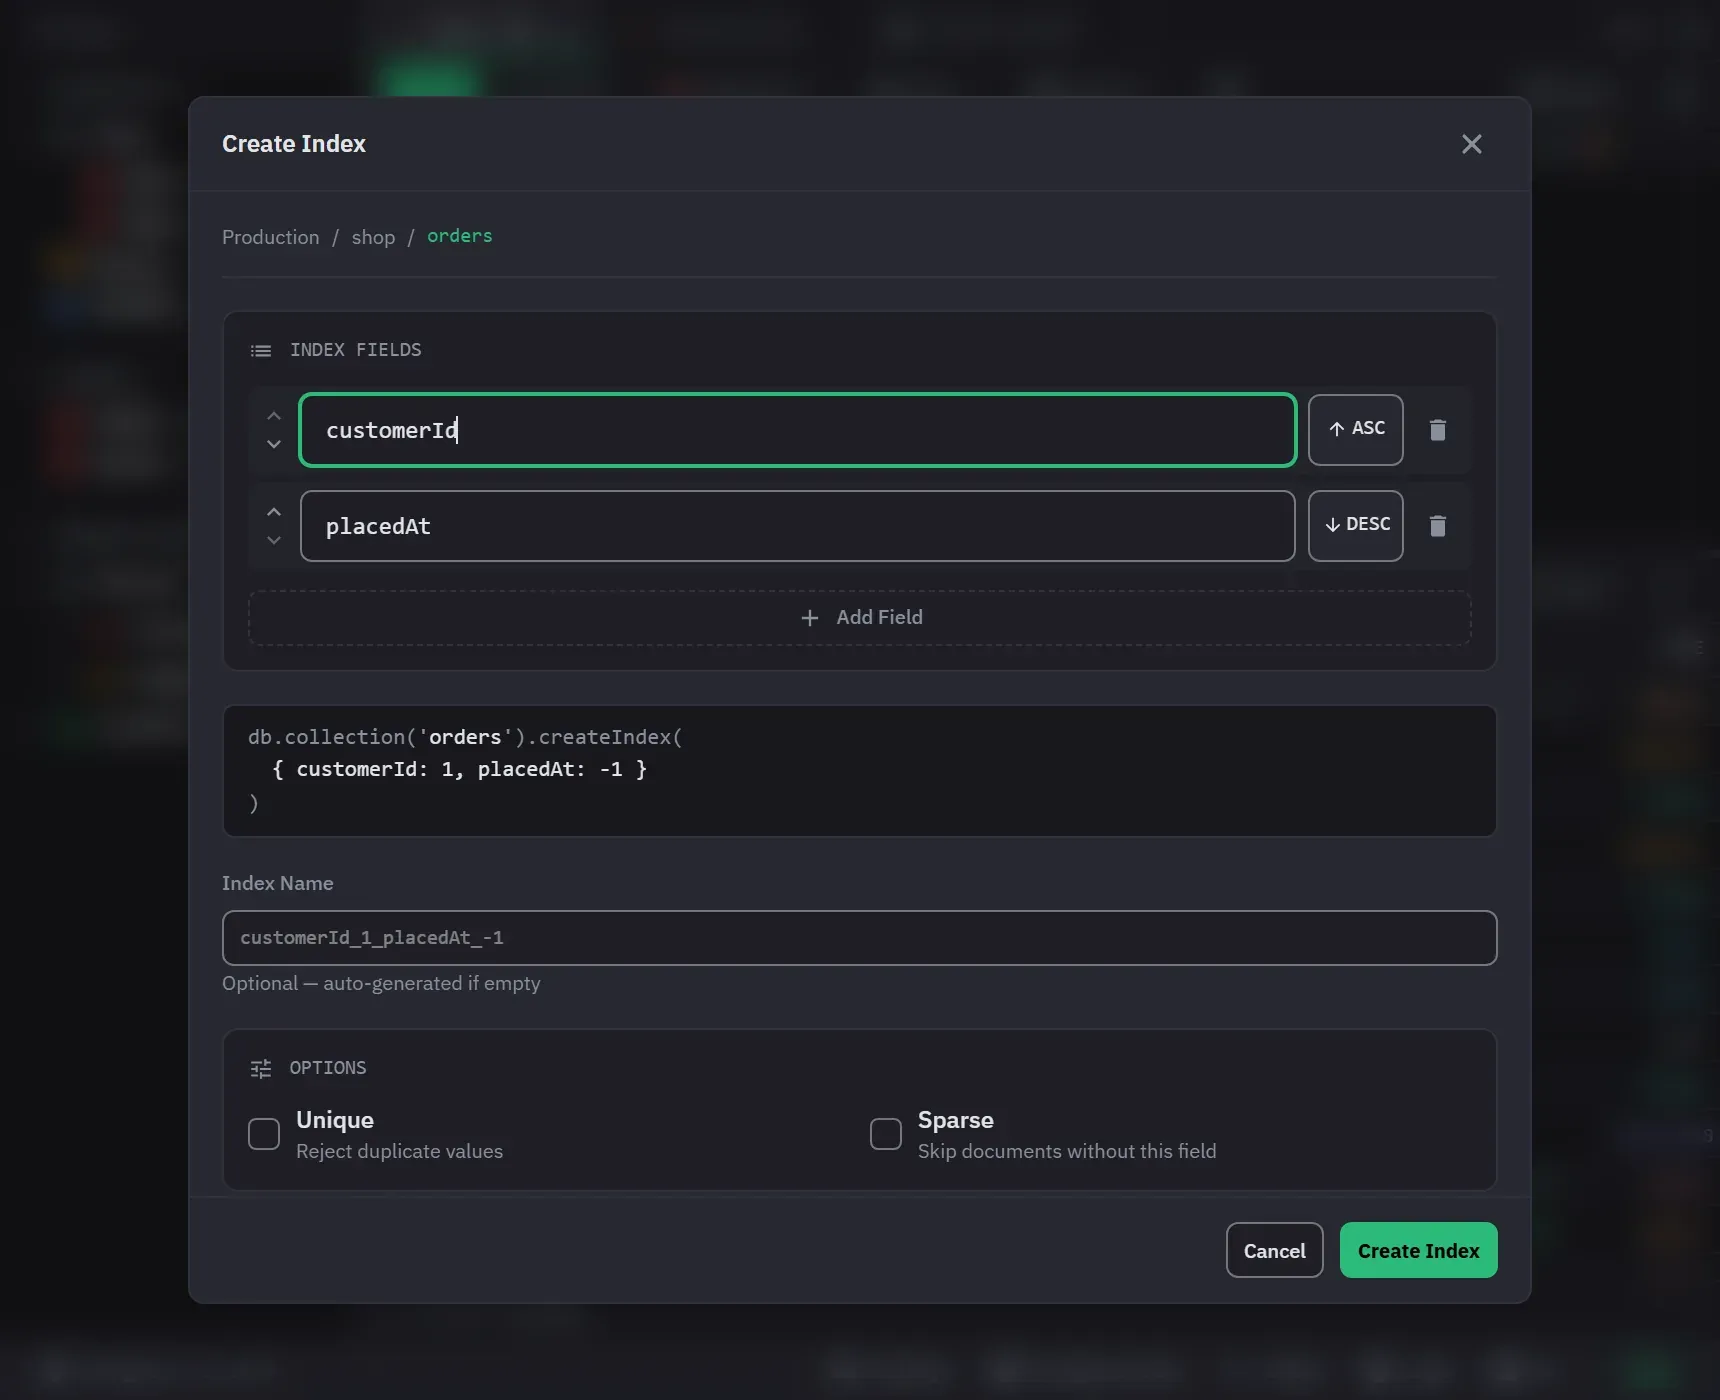
Create an index on one form
Pick the fields in order with their direction, name it or take the name the server would give it, and read the createIndex command before it runs.
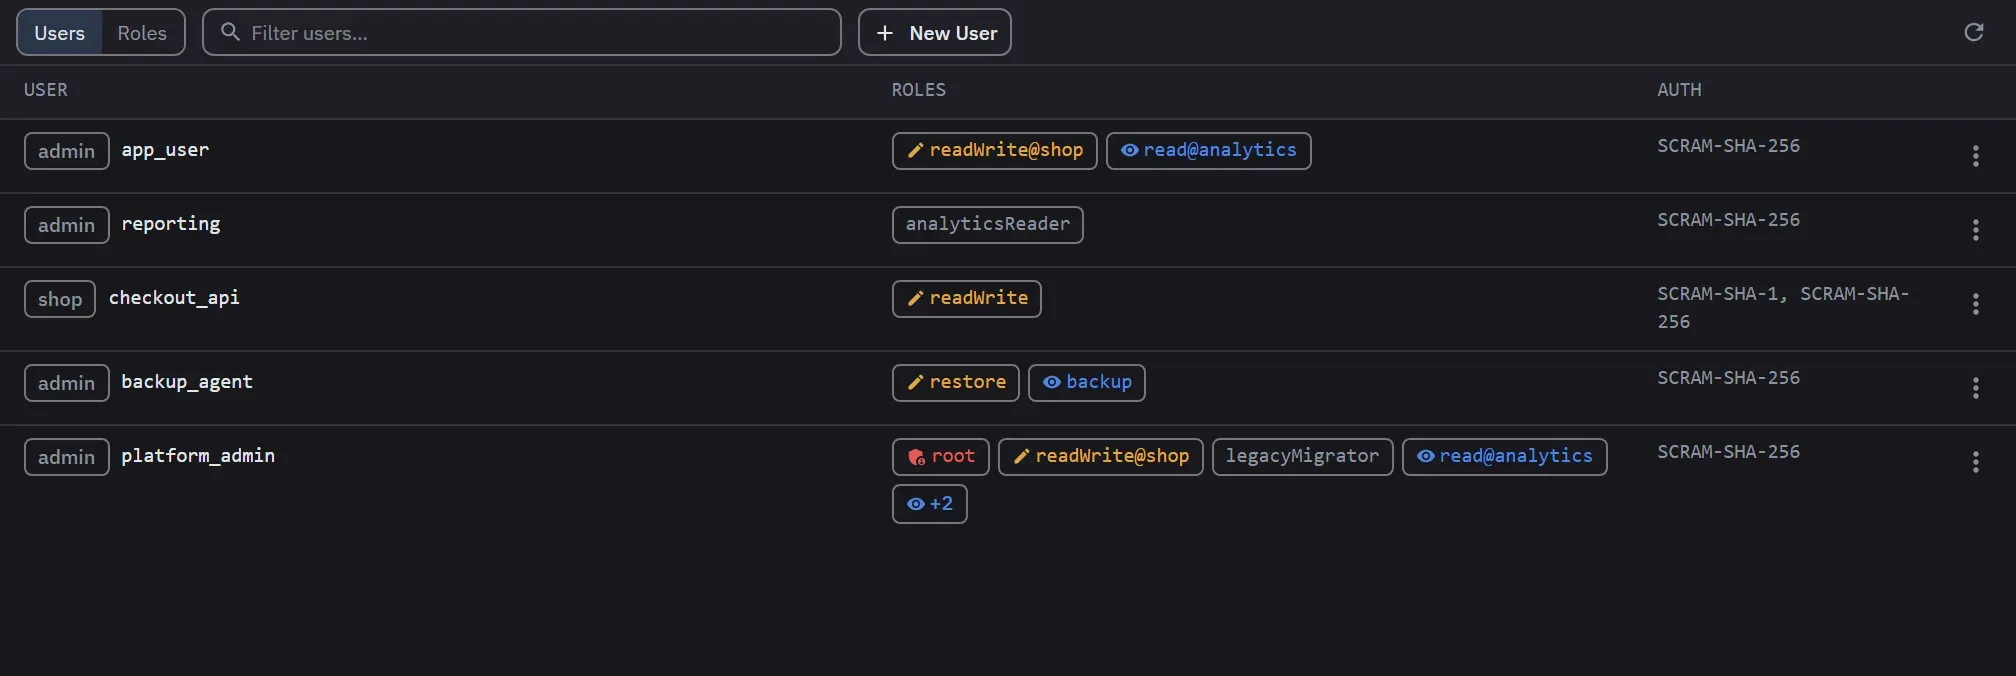
Users and roles
On Pro, list the database users and the roles they hold, and create users and custom roles.
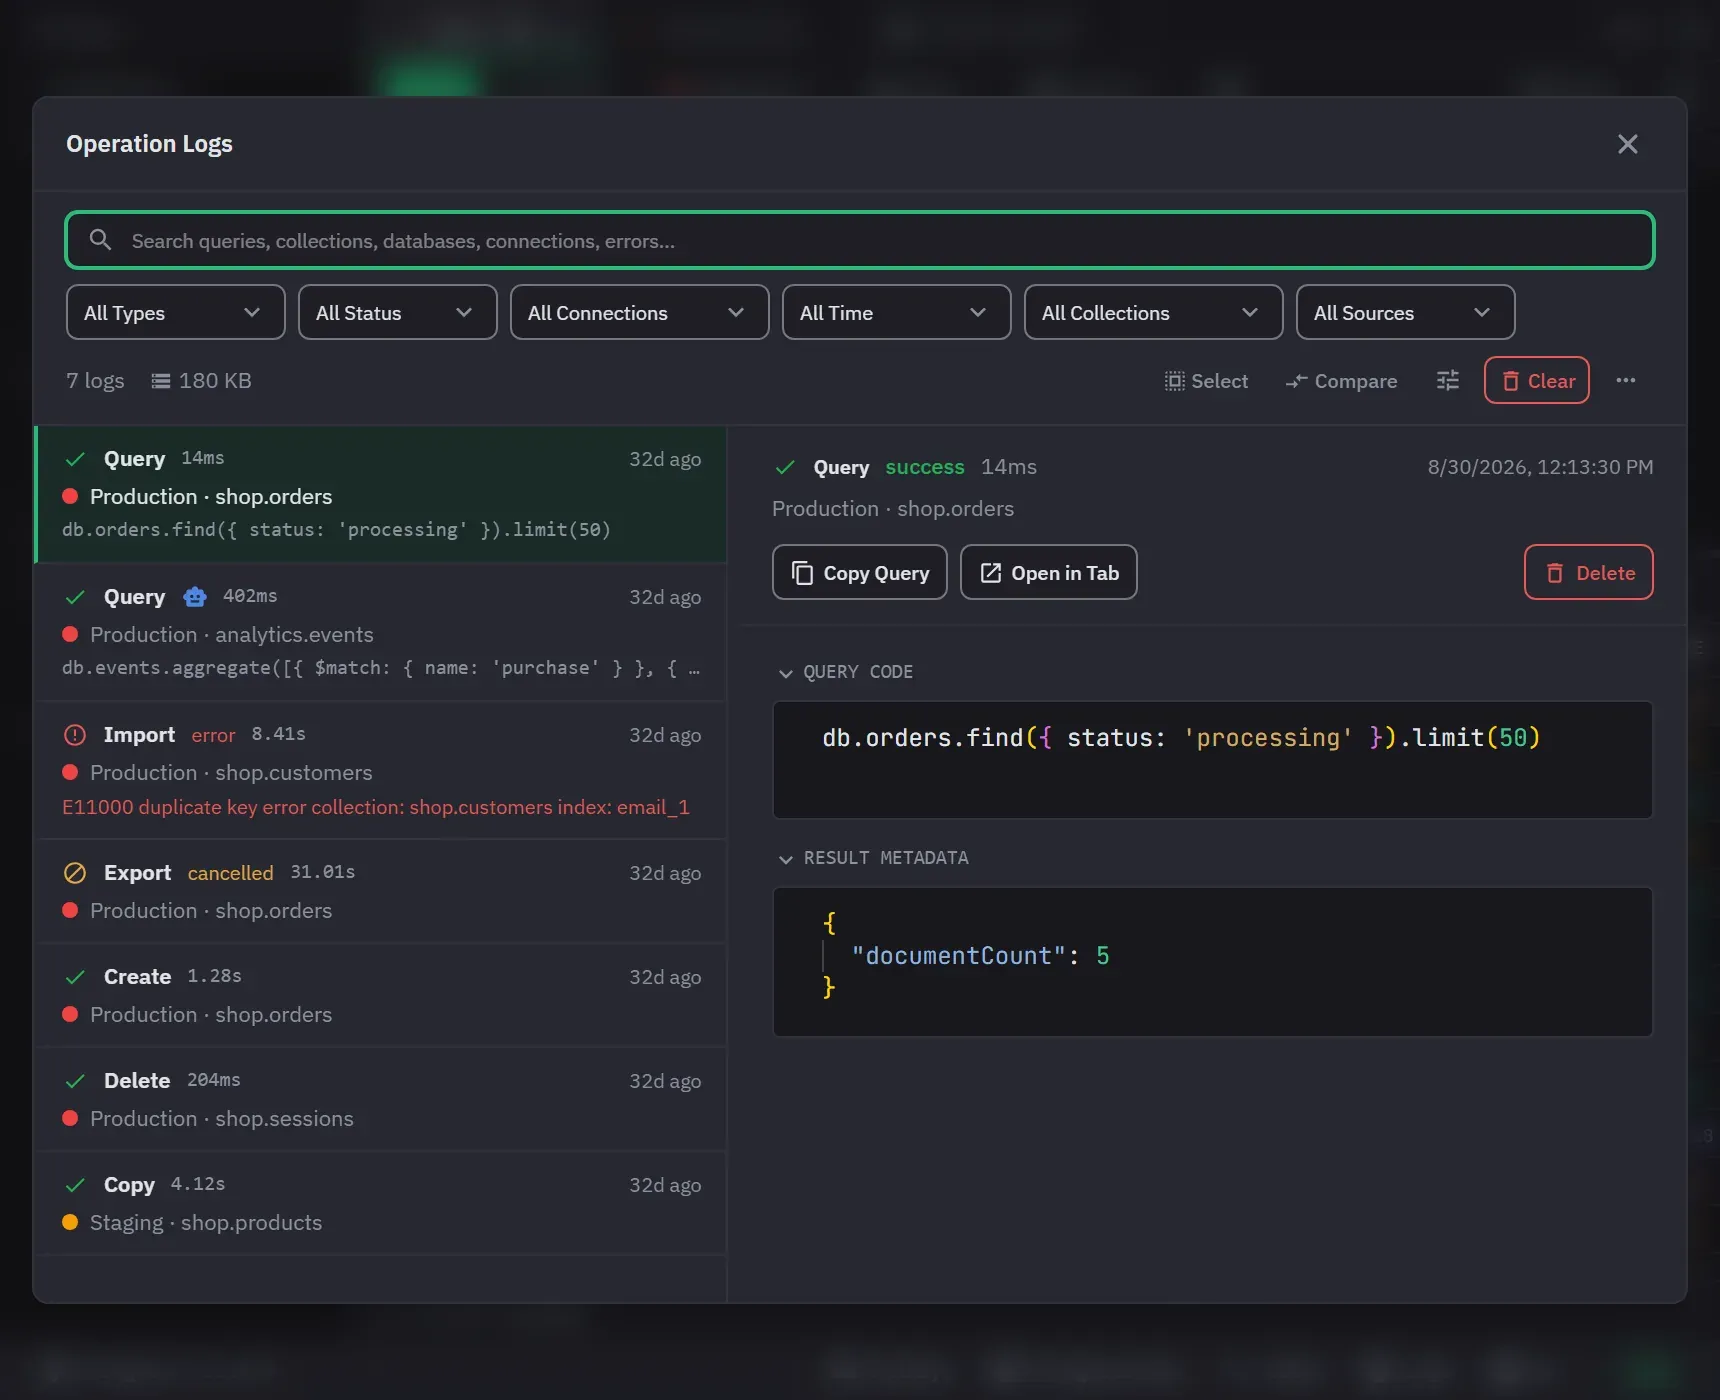
A log of everything the app ran
Every operation Monghoul ran, searchable and filterable, with its duration and outcome. Free reads the newest 250 entries.
Also in this part
- Indexes
- Inspect, rebuild and drop indexes. A drop always asks first.
- Validation
- Edit a collection’s
$jsonSchemawith its validation level and action. - Slow queries
- On Pro, slow query analysis and the database profiler.
Try it against your own data
38 MB installer. Free forever, and a 14-day Pro trial with no card.