Cluster monitoring
Live server metrics, connection usage, replica set health, slow queries, and the profiler.
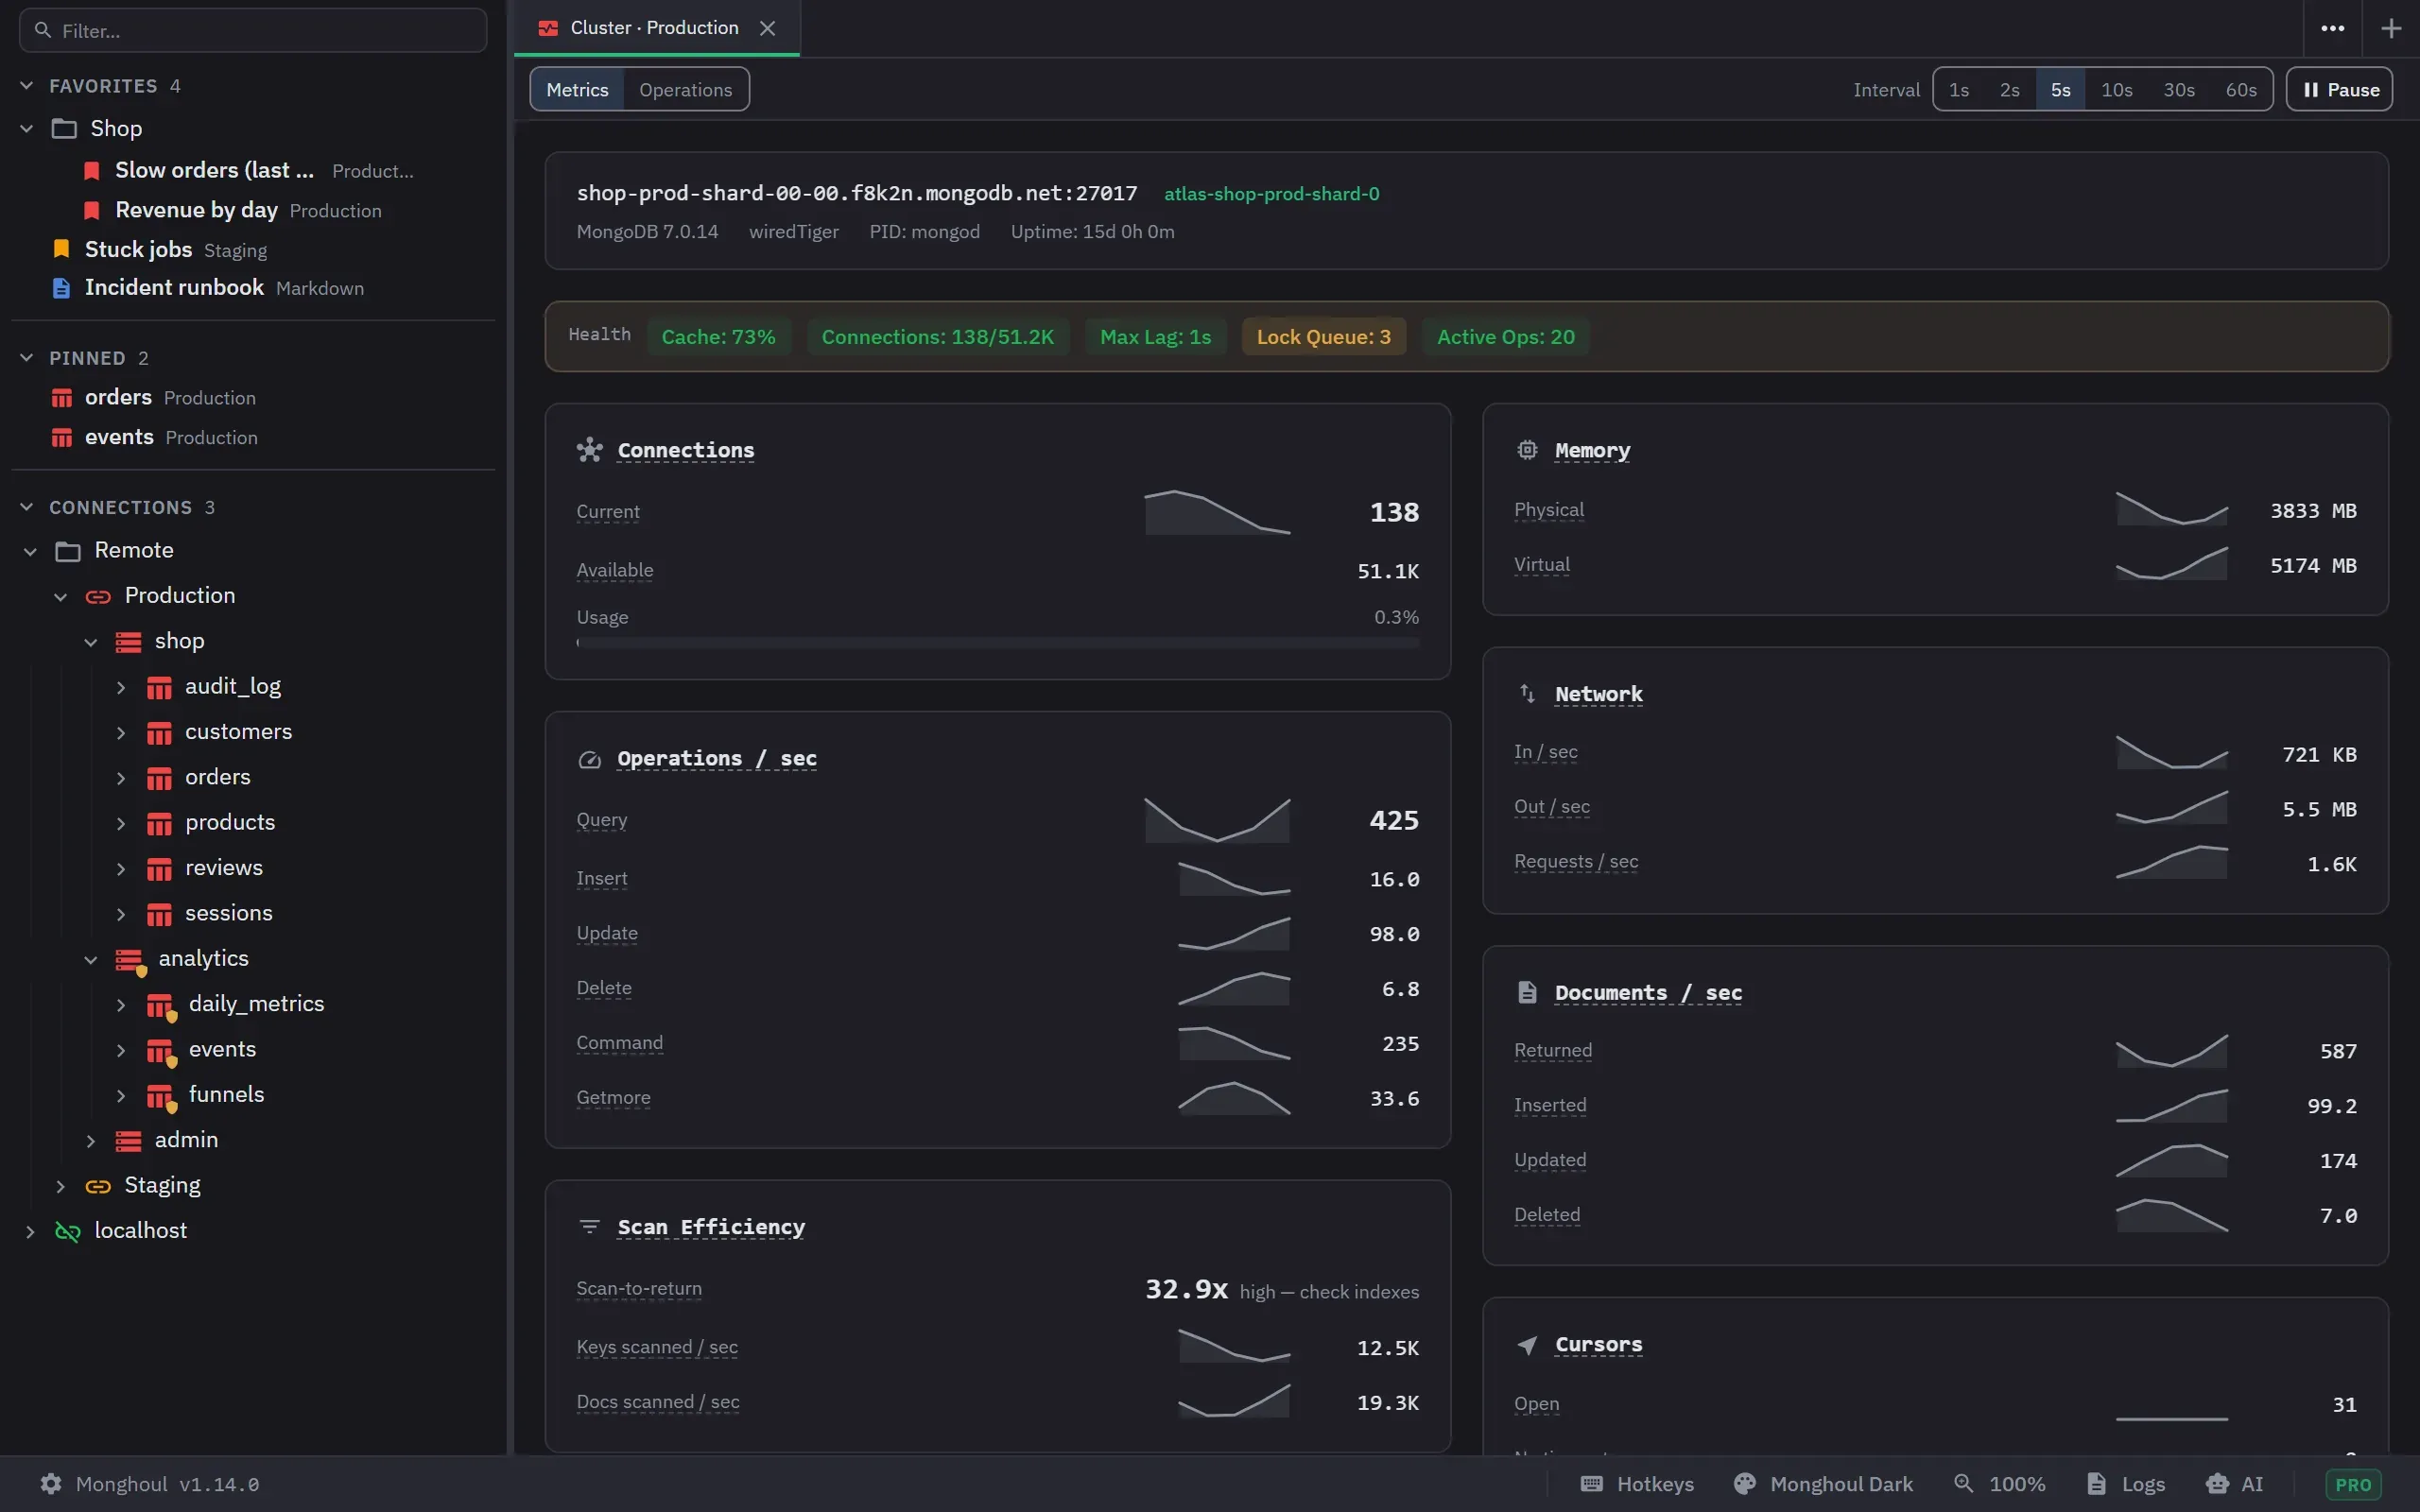
Cluster Monitor, in a connection’s context menu, opens a live monitor as a tab titled
Monitor: <connection>. Each use opens another tab, and each tab polls the server while the app is
open. On Free the entry carries an upgrade badge and opens the upgrade dialog, and the app refuses
every monitoring request. The header names the host, the MongoDB version, the storage engine, the
uptime and the replica-set identity.
The tab has two views, Metrics and Operations. A status indicator reads Live, Paused, Error or Pro required, and shows how long the tab has been monitoring. That time leaves out paused periods.
The metrics
Metrics cover these groups.
- Connections: current, available, total created since the server started, and a usage bar.
- Operations per second: query, insert, update, delete, command and getmore.
- Memory: physical (resident) and virtual, in MB.
- WiredTiger cache: used against configured size, dirty bytes, pages read and written per second, and read and write tickets available against total. Tickets show only when the server reports them. MongoDB 7.0 moved them. The whole card is absent when the server reports no WiredTiger cache.
- Network: bytes in and out per second, requests per second, and cumulative totals.
- Global lock: active read and write clients, and queued readers and writers.
- Documents per second: returned, inserted, updated and deleted, plus cumulative totals for returned and inserted.
- Cursors: open, no-timeout, and cumulative timed out.
- Scan efficiency: keys and documents scanned per second, and a scan-to-return ratio that is flagged as high above 10 times. It shows only while documents are being returned.
- Replica-set members: health, latency and lag, one entry for each member, with its state and a mark on the member you are connected to. The card is absent when the deployment reports no replica-set status.
Rates come from the change between two samples, so every rate reads zero until the second sample arrives.
A health strip across the top rates five of those as healthy, warning or critical: cache use, connection use, replica lag, lock queue, and active operations. Replica lag appears only on a deployment that reports replication. The strip’s background follows its worst entry. It is the part to read first, and the detail below it is where you go once something is not green.
Metrics that have history carry a short trend chart with time-aware hover values. The history holds the last 30 samples.
Operations
The Operations view has three modes. Leaving it for Metrics discards its filters, sort, expanded rows and history. They start empty on the next visit.
Live shows what is running now, up to 500 operations. A duration filter, set to All or over
100 ms, 1 s, 5 s, 30 s or 60 s, runs on the server. A search box matches the namespace, client,
application name and operation type, and the columns Collection, Duration and Plan sort. The User ops
switch hides MongoDB’s own work, which is replication, heartbeats and the local and config
namespaces. Monghoul’s own monitoring traffic never shows.
- A row is tinted by duration. A mark shows when it waits for a lock or runs a full collection scan.
- A click on a namespace filters the list to it, and a second click clears the filter.
- Expanding a row shows the operation id, type, collection, client, application, yield count, lock state and the command as formatted JSON.
- A summary bar gives the number of operations, how many scan the collection, how many wait for a lock, and the longest duration. In Live these counts describe the unfiltered list.
- To terminate an operation, press its button once. It reads Confirm? for three seconds, and a second press sends the kill. Arming another row moves the arm.
History keeps up to 200 operations that ran for a second or longer, and it separates running work from finished work with the time each one ended. It records for as long as the Operations view stays open, and its size shows on the History button.
Profiler has a database picker that lists your databases and leaves out admin, local and
config. It sets the selected database’s profiling level to off, slow-only, or all, and reports the
slow-operation threshold in effect. It then shows the 200 most recent profiled operations.
- Each row carries the operation, collection, duration, plan, documents examined against documents returned, and the time. The ratio is flagged when the query examined more than ten documents for each document returned.
- Expanding a row adds the client, application, user, index entries checked, response size and the command as formatted JSON.
- A collapsible Slowest collections summary ranks the top ten collections by total time and marks those that scan the collection. A click on one filters the table. It shows only when more than one collection is present.
- With profiling off, the profiler says it shows historical data and does not present an empty result as a failure.
- Export writes the rows the current filter shows, as JSON or CSV. It is unavailable when there are no rows.
Polling and errors
The refresh interval is 1, 2, 5, 10, 30 or 60 seconds. The default is 5 seconds, and the tab remembers your choice. Pause stops polling and keeps the last sample or the error panel on screen. Resume fetches at once and then keeps the interval.
Polling skips its turn while the window is hidden. It keeps running while another tab is active, so the charts have no gap when you come back.
A permission error names the MongoDB privilege the metric needs, rather than reporting a bare failure.
| Needs | Privilege |
|---|---|
| List operations | the clusterMonitor role, or the inprog privilege |
| Terminate an operation | killop |
| Switch the profiler | dbAdmin. Without it, the profiler shows “No dbAdmin access” in place. |
| List databases | listDatabases |
| Read profiler data | read access to system.profile |
Monitoring stops after an error and starts again only when you retry, so a broken connection does not
keep hammering the server. When the error gives no reason, the panel says that the clusterMonitor
role may be required.
If Pro access ends while a monitor tab is open, the tab stops polling and offers an upgrade. The tab stays, and monitoring resumes when Pro is active again.