Read your results, and see why a query is slow
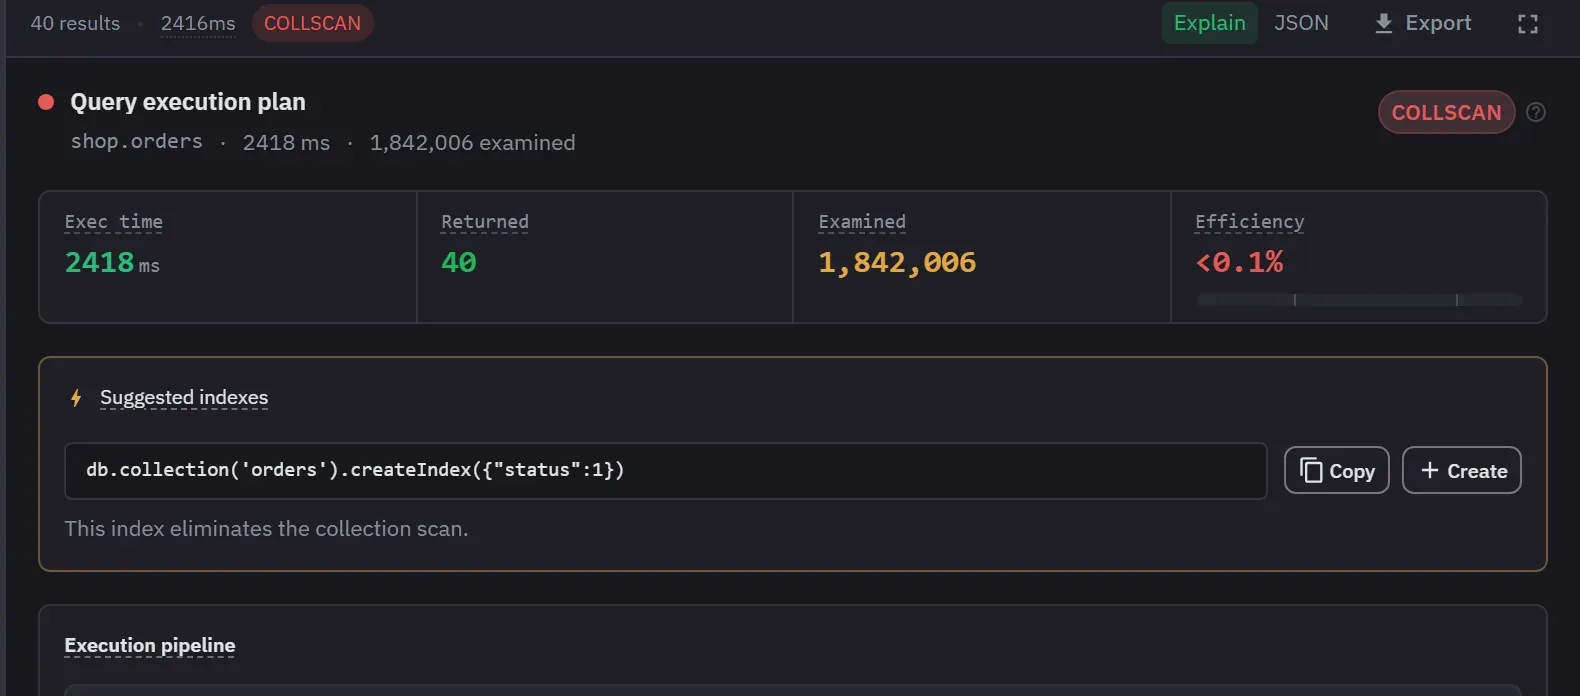
Switch between table, tree and JSON without running the query again. A find or aggregation is explained by default, so a collection scan is flagged with the index that would fix it.
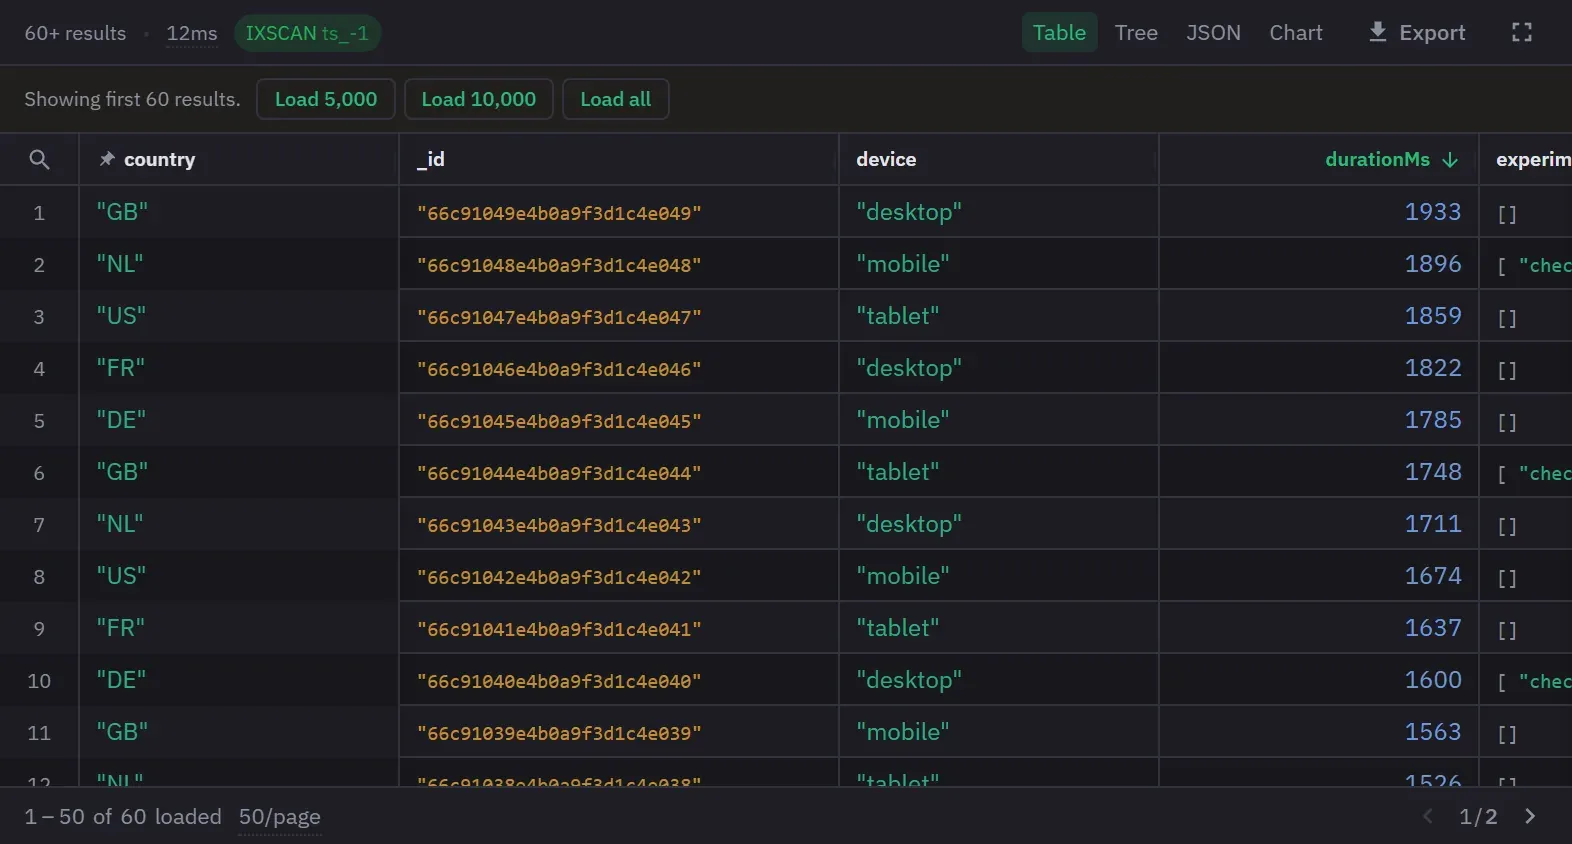
A table that keeps up
The table is virtualized, so a long result scrolls without a pause. Pin a column, sort, resize and reorder, and select rows to copy or delete them together.
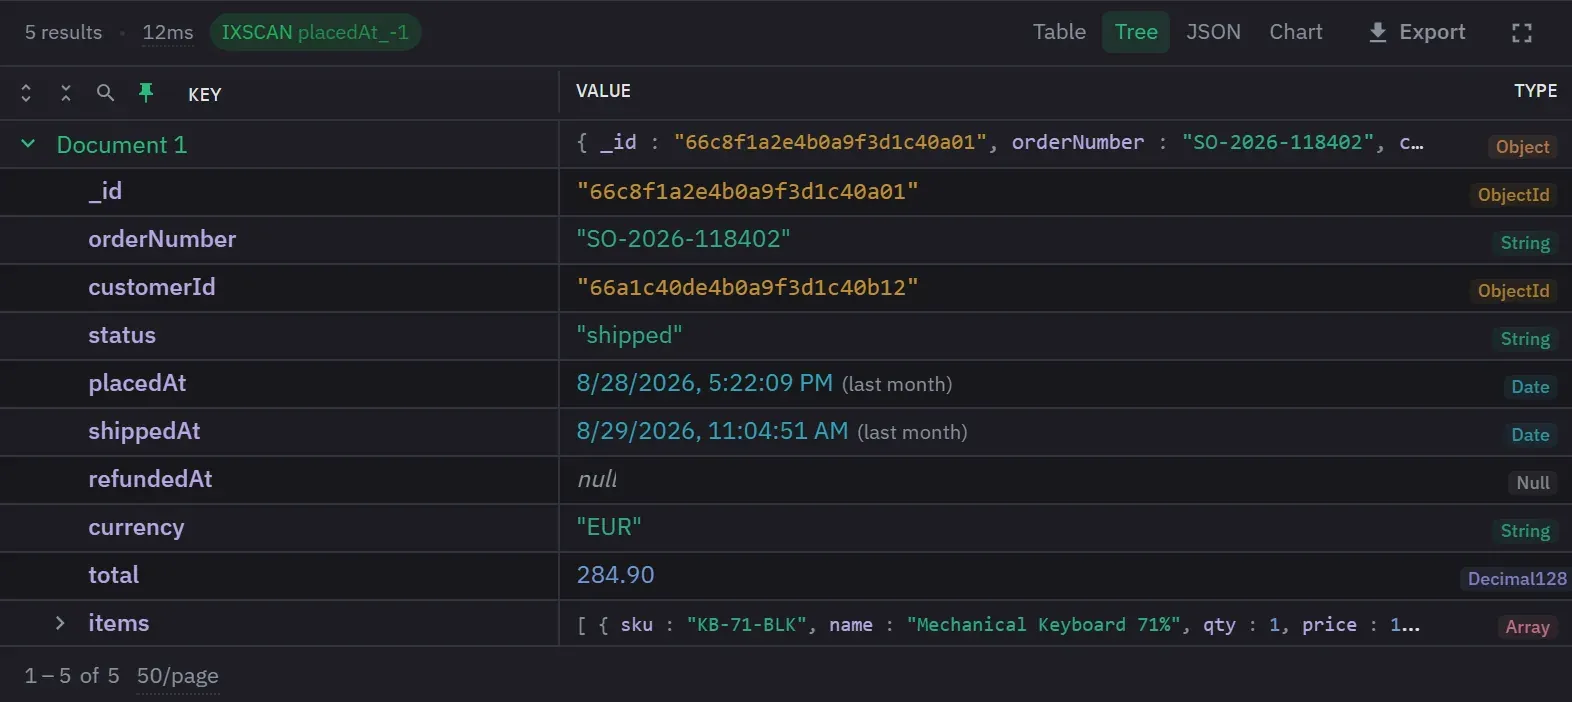
Every value with its type
The tree names the BSON type of each value, so an ObjectId stored as a string, or a total kept as Decimal128, shows without opening the document.
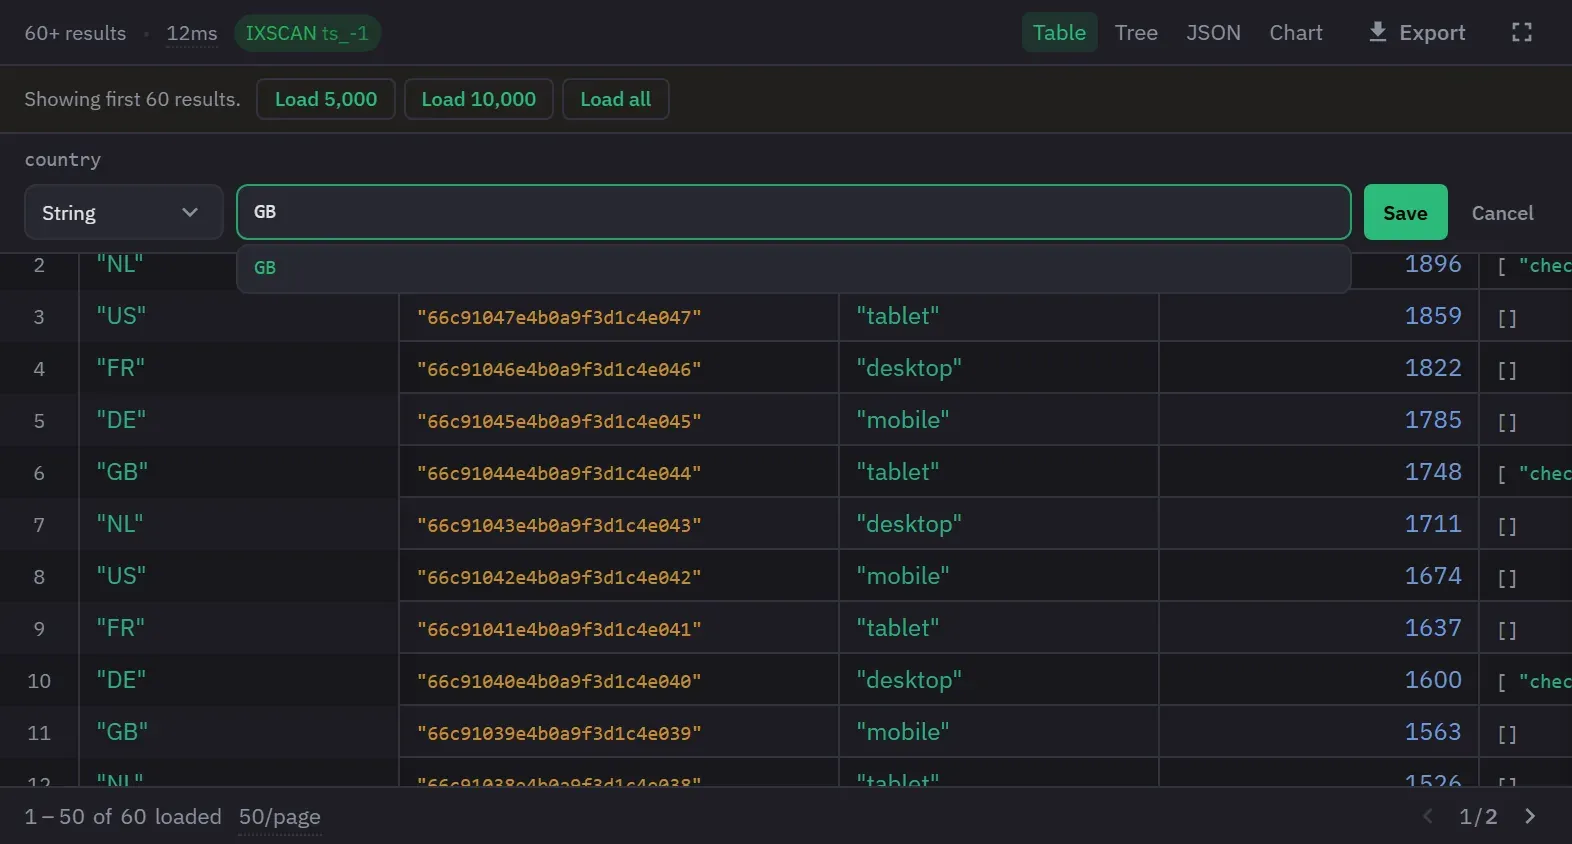
Edit in place
Edit a cell in the table with an editor shaped by its type, and pick from the values the field already holds.
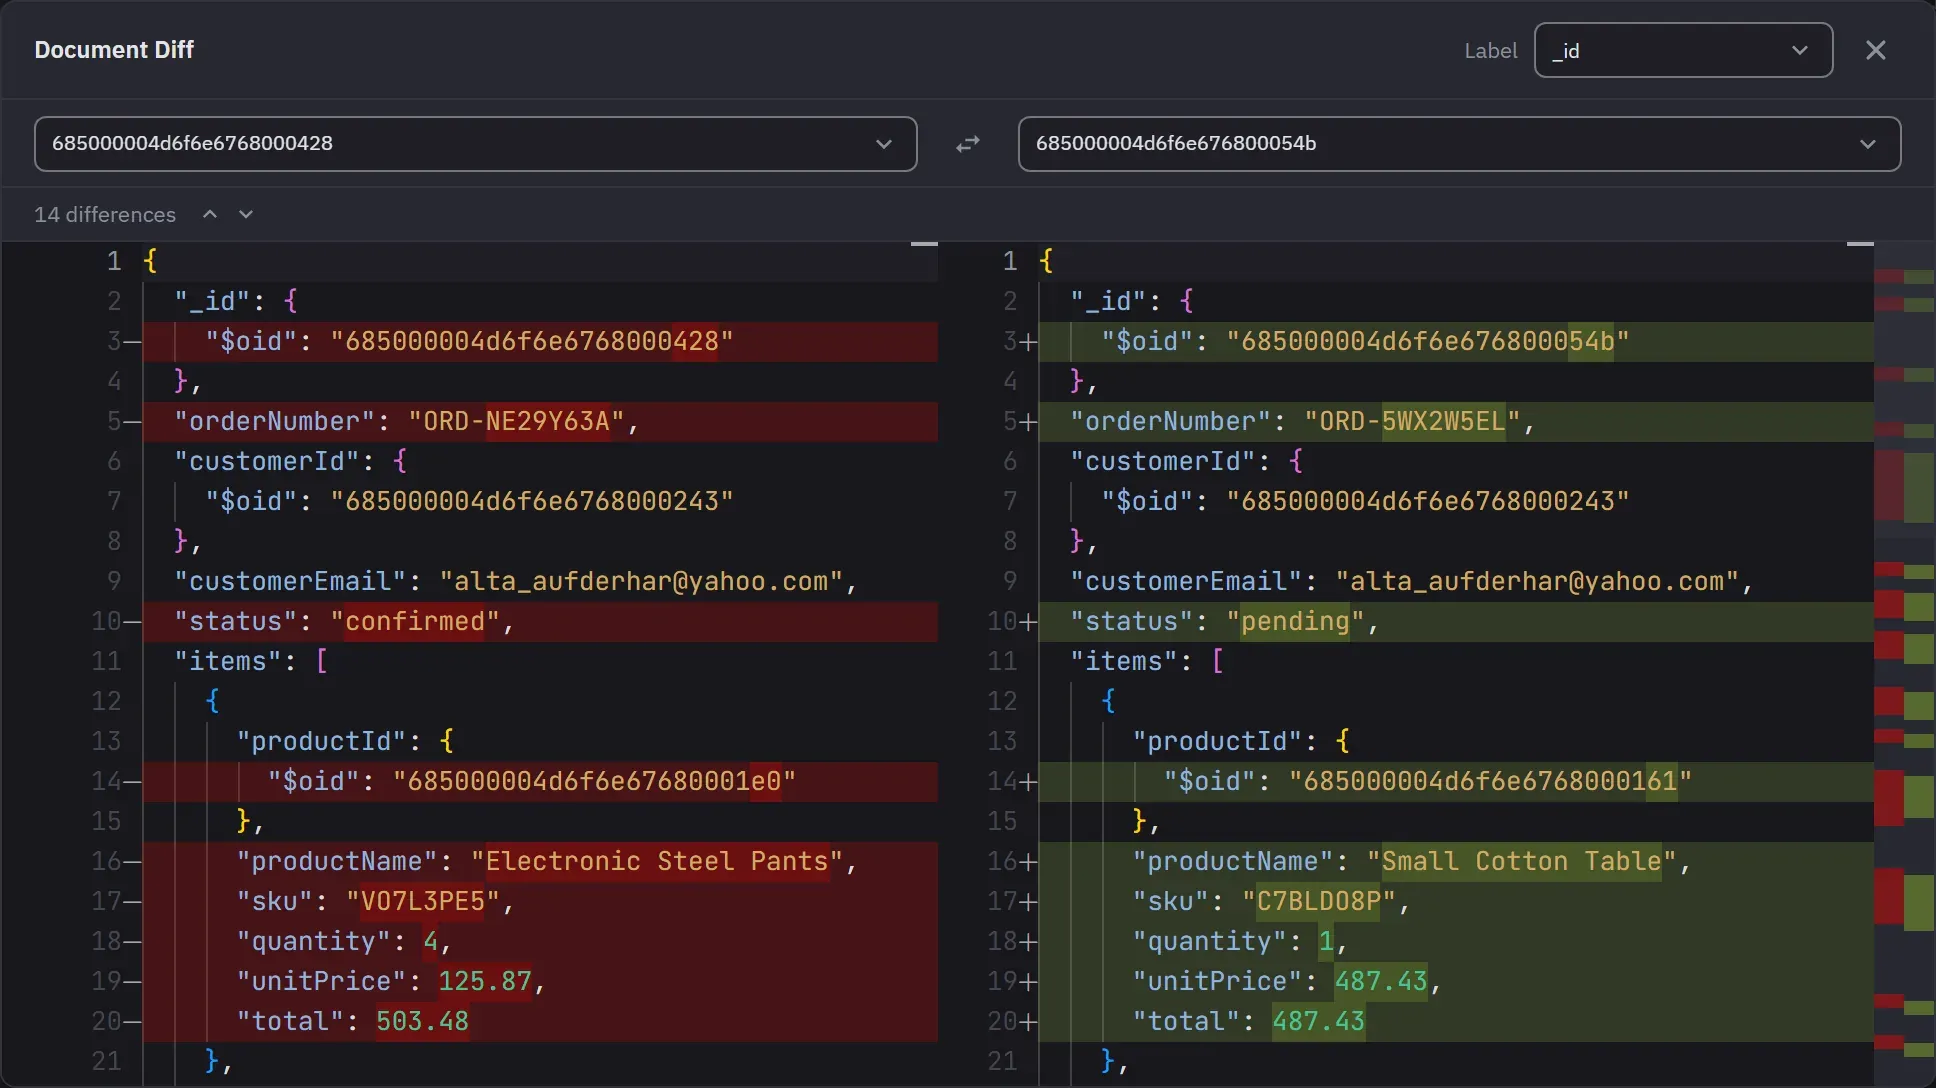
Two documents side by side
On Pro, select two documents and compare them field by field, with the changed lines marked and a count of the differences.
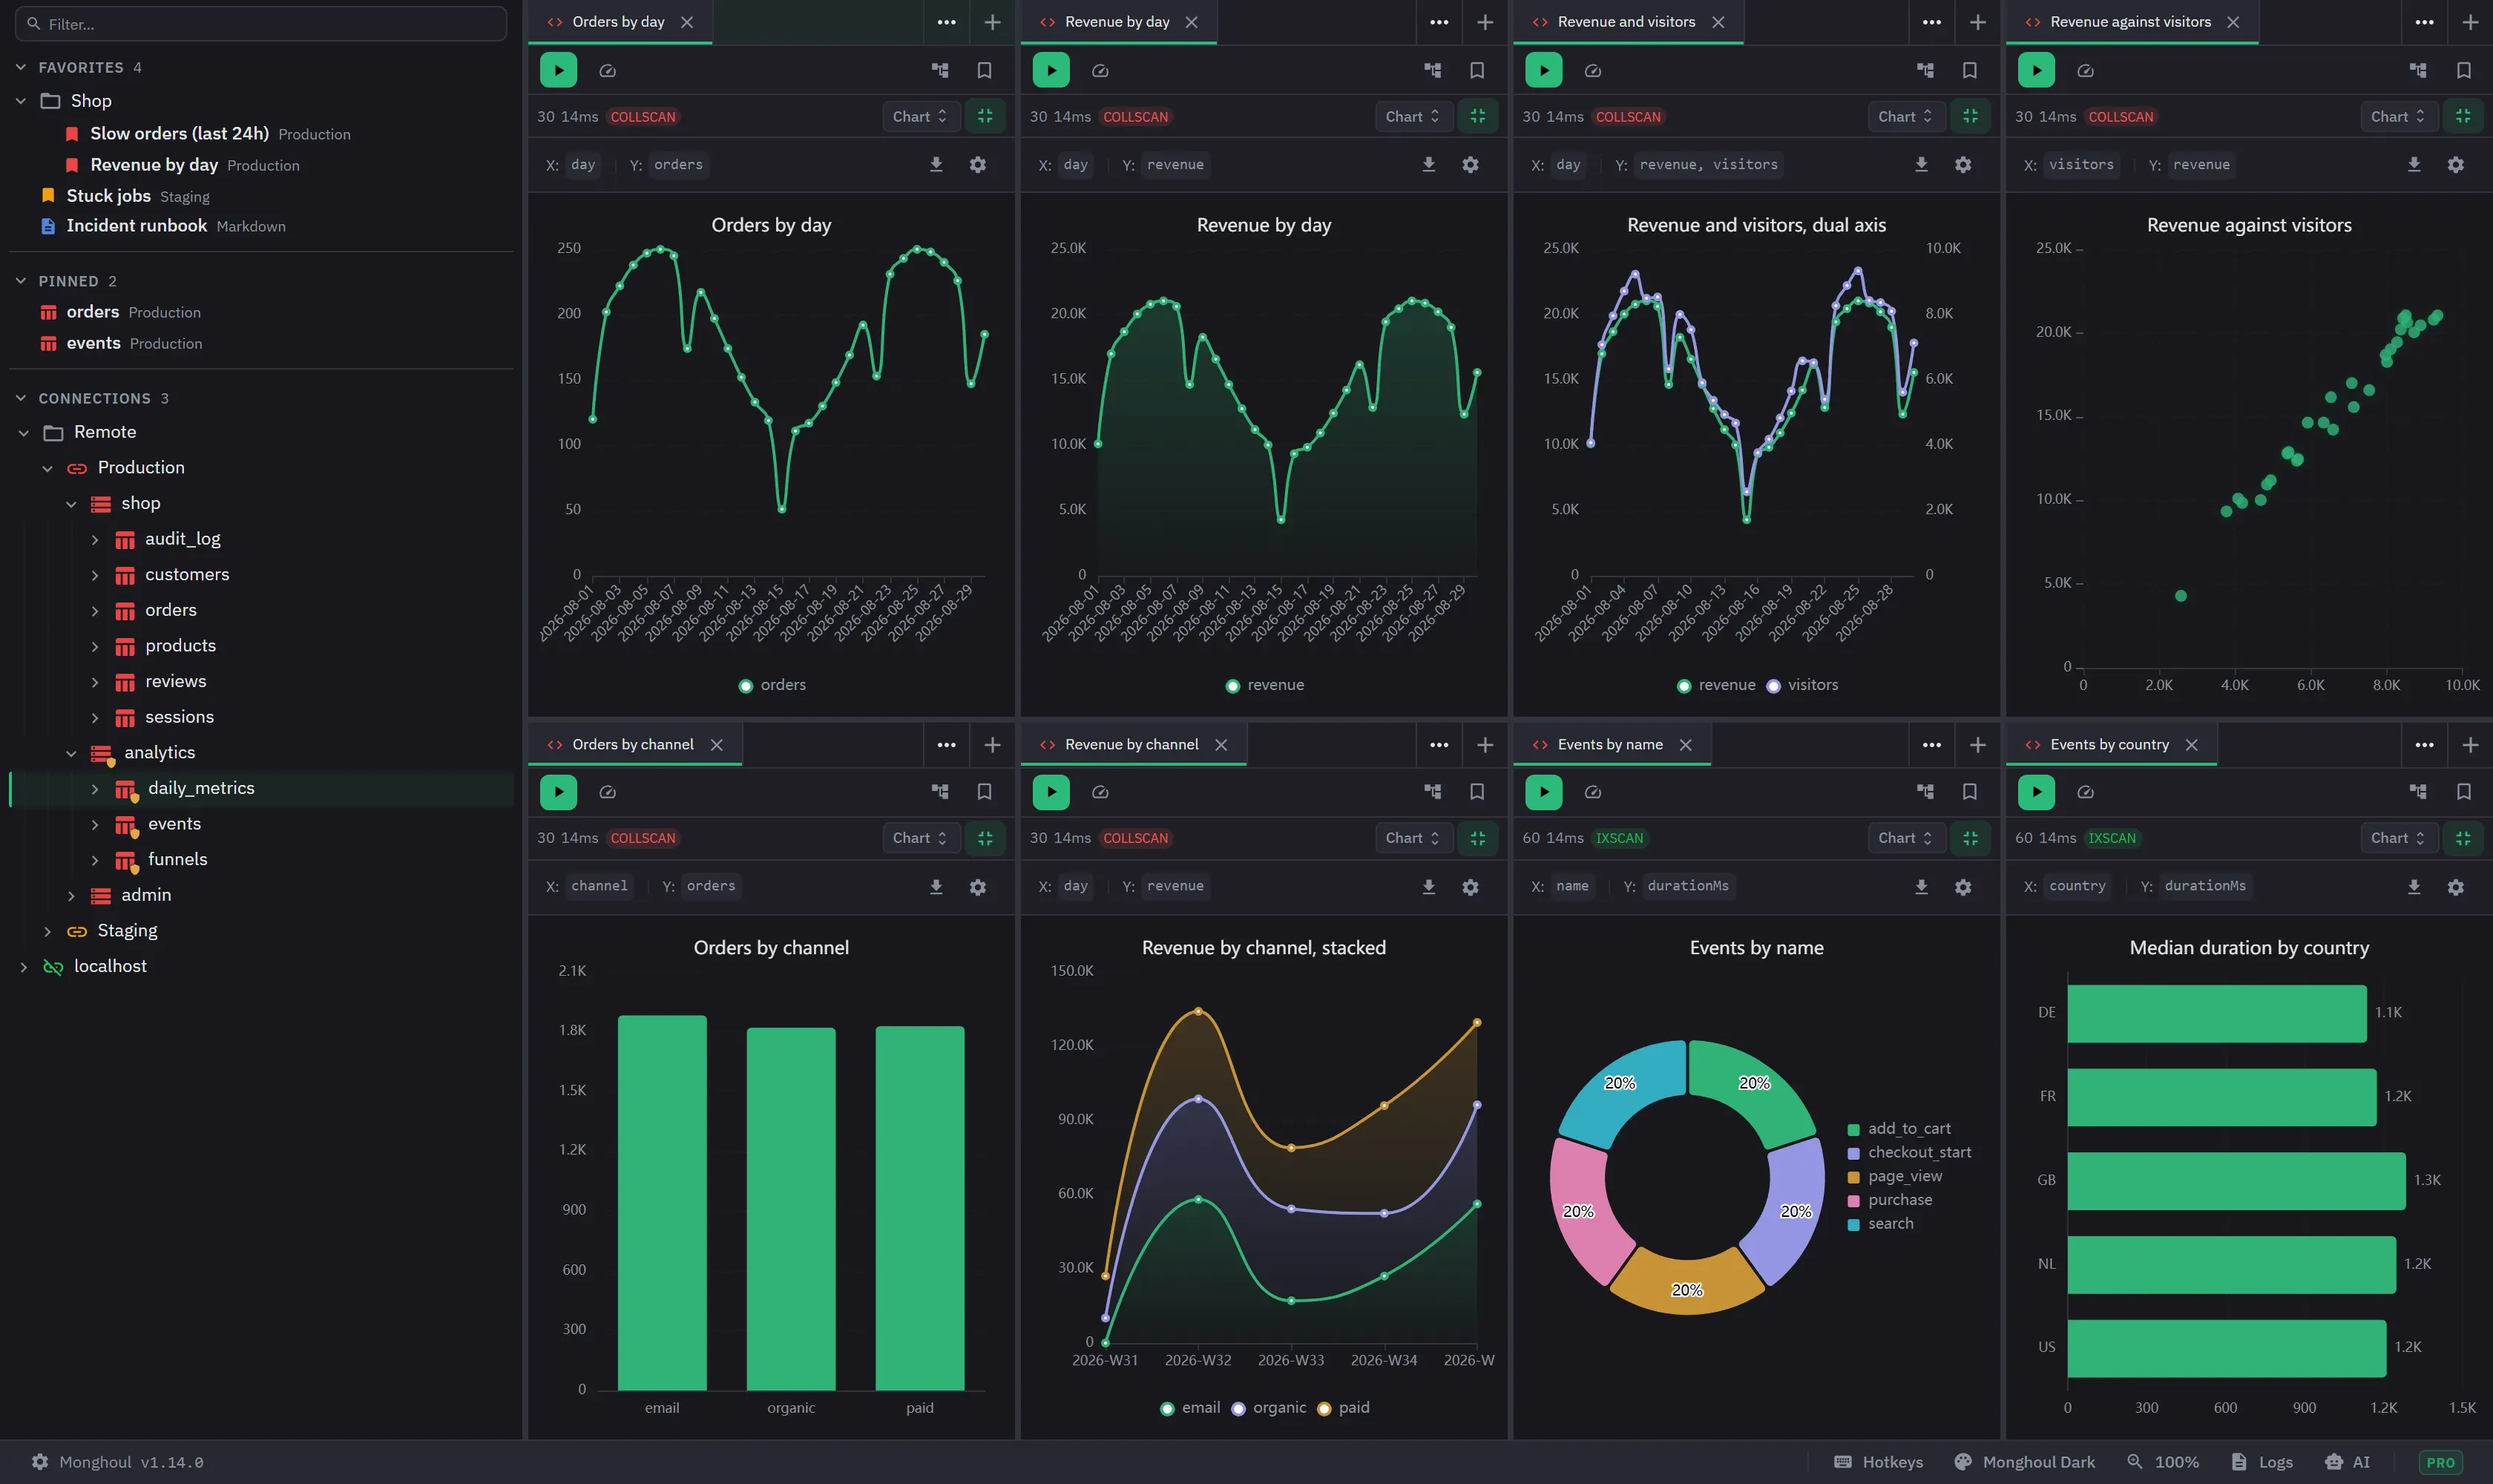
Charts from the same result
On Pro, chart a result as bars, lines, areas, a pie or a scatter, and keep a panel of saved charts, each running its own query.
Also in this part
- Explain
- A plan graded collection scan, indexed, optimal or ungraded, with the plan as a tree, scan efficiency, rejected plans, and the index that would fix it. A pipeline that writes is never explained.
- JSON
- The current page as indented JSON, read-only, one click from the table and the tree.
- Search
- Search across pages with each matching cell highlighted, and a preview drawer that follows the focused row.
Try it against your own data
38 MB installer. Free forever, and a 14-day Pro trial with no card.