Result views
Six ways to read a result set: table, tree, JSON, result, explain, and chart.
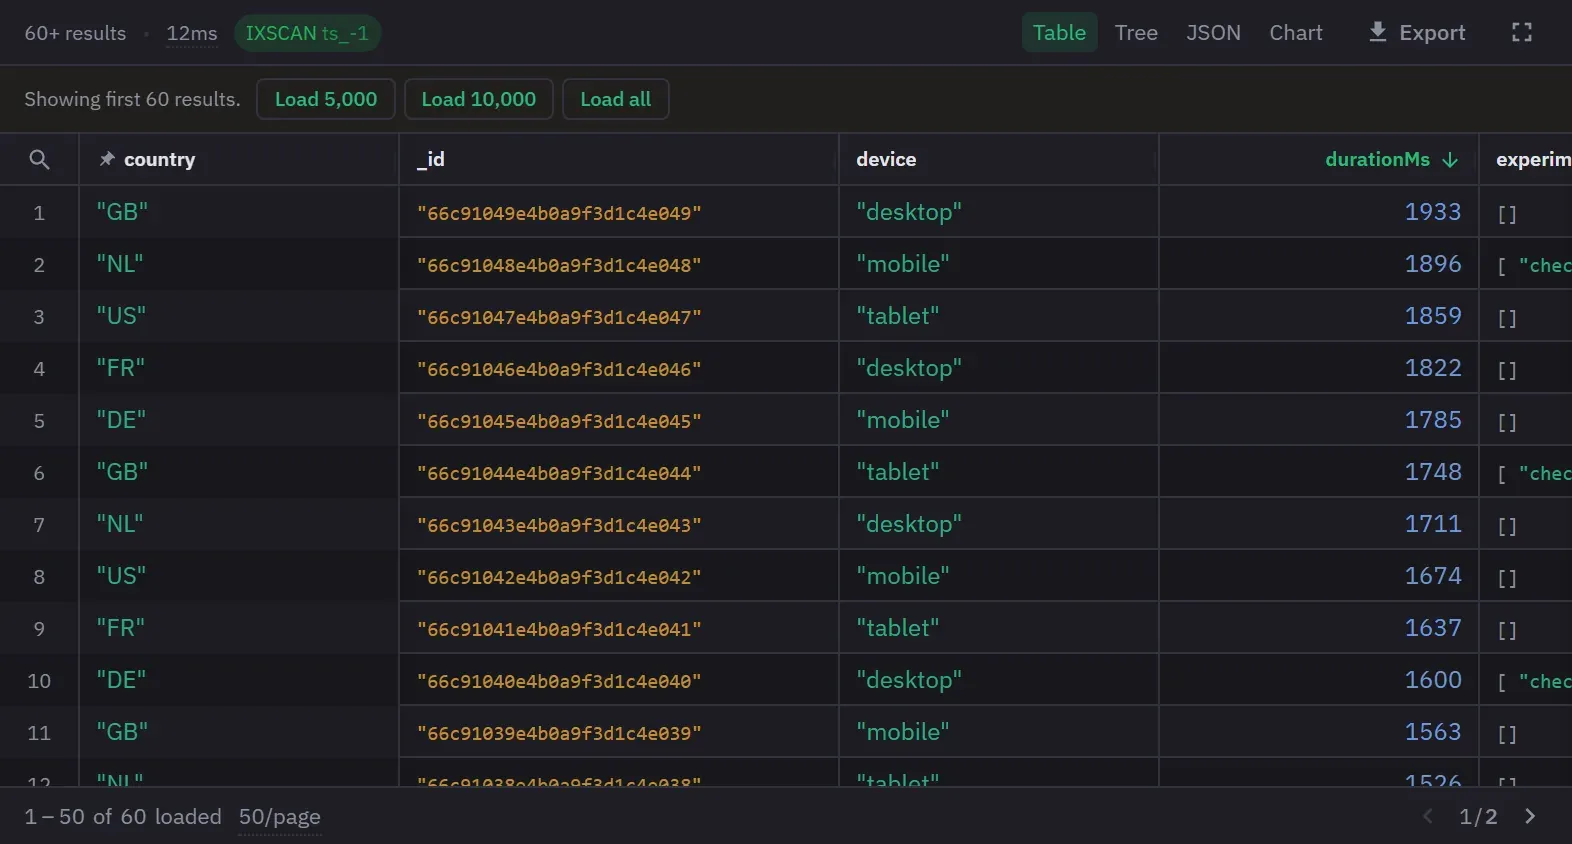
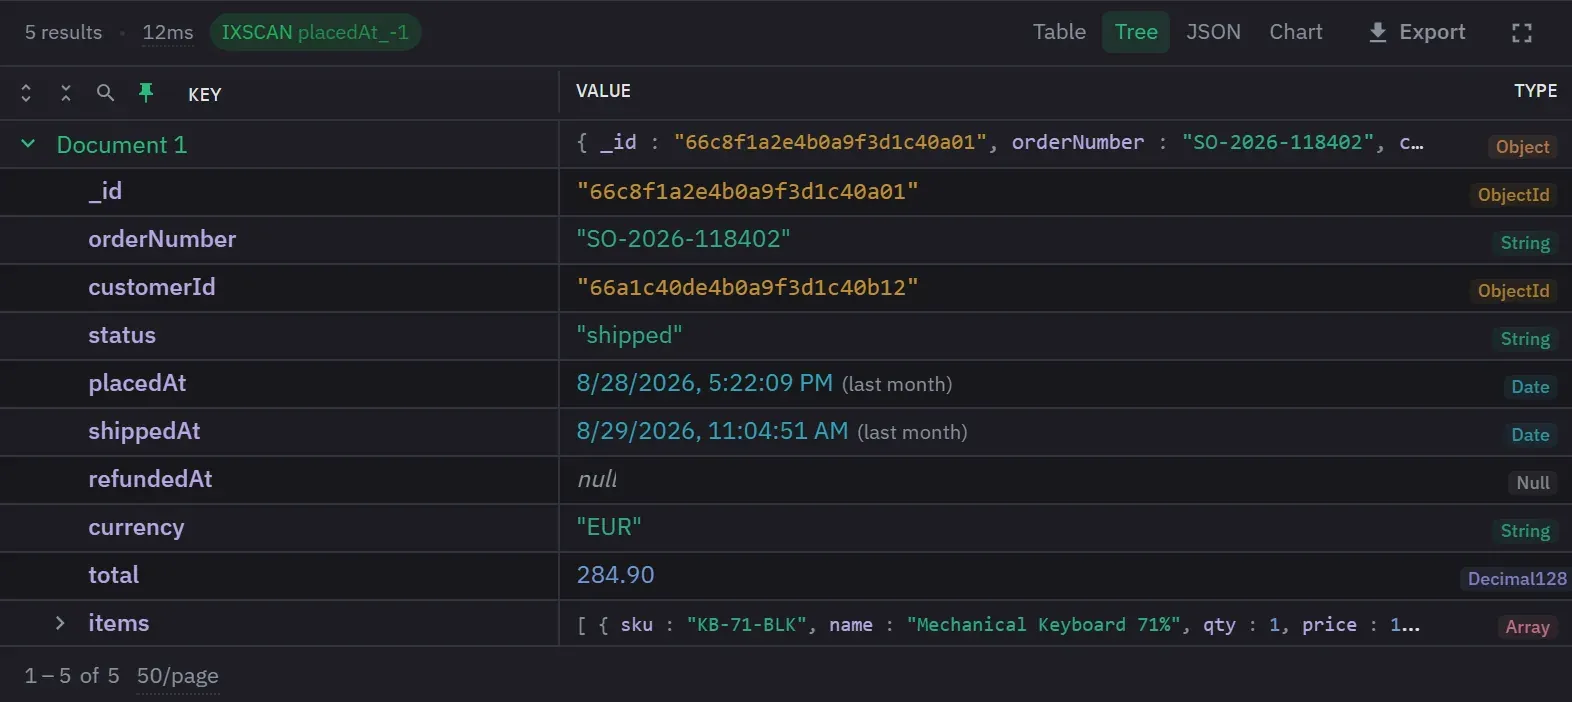
A result can be read in six ways. Tree and Table are the two you will spend time in. JSON shows the result as formatted text, Result shows a write outcome or a single value as a card of copyable metrics, Explain shows the plan, and Chart draws the result on Pro.
The shape of the result decides which views are offered:
| Result | Views |
|---|---|
| A list of documents or objects | Table, Tree, JSON and Chart |
| A single document or object | Tree and JSON |
| A list of plain values | JSON |
| A write outcome or a count | Result and JSON |
| A single value | Result |
| An explain result | Explain and JSON |
The switcher shows only when the result supports more than one view. On a narrow panel it becomes a dropdown. On Free, the Chart view is listed but dimmed and marked PRO, and a click on it opens the upgrade dialog. See Charts and visualization.
The active mode persists per tab and in favorites. A new result returns the panel to the first page and picks the view again. An inline edit or a delete does not. A failed query leaves the chosen view and its state alone. Switching to another view and back resets that view’s own state, such as sort, column widths and expanded rows. A chart keeps its configuration, because the tab stores it.
To set a default for new queries, right-click the Tree or Table button. The menu offers “Set Tree as default view” or “Set Table as default view”, and “Reset to auto-detect” to let each result pick.
Until a query runs, the panel says “Run a query to see results”. While a query runs it shows a spinner and the elapsed seconds. A failed query shows an inline Query Error panel. A query that matches nothing shows “No documents found” under a header that still has the timing and the scan badge.
Result and JSON
The Result view shows a delete, update, insert-one or insert-many outcome as a card. The card names the operation, says whether the server acknowledged it, and gives the counts. You can copy an inserted identifier from the card. A count is one large number. Any other single value shows its BSON type name above it, and a long value is cut short.
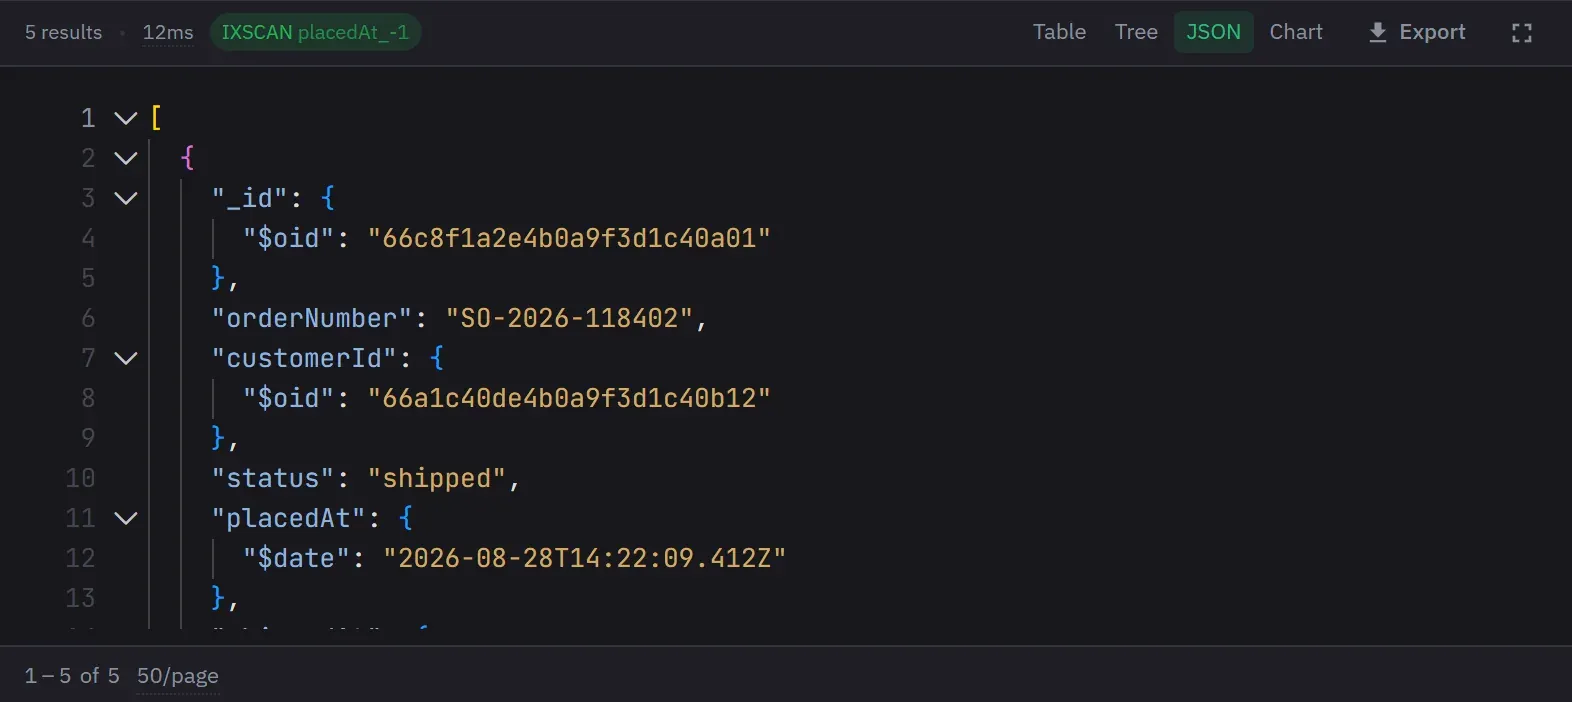
The JSON view shows the current page of the result as read-only, indented JSON.
Laying out the panel
The editor and result split is resizable and the result panel collapses, both persisted per tab. Fullscreen comes in two sizes: Tab fills the tab with the results, Window fills the app. Escape leaves either, unless a text field has focus or a value is being edited. Fullscreen persists per tab.
Dragged down to a sliver, the panel shows only the result count. Below about a hundred pixels it drops the pagination bar. A narrow panel hides the export button and the page-size control.
The preview drawer opens with Ctrl/Cmd+I in Tree and Table. It follows row focus and shows the focused document as read-only, foldable JSON, headed by its position in the result. Its Edit button is unavailable, and says why, for a document with no usable identifier. The drawer is at least 200 pixels wide and resizes by drag or with the arrow keys on its divider. Its width and open state persist per tab.
Keyboard shortcuts
Five shortcuts act on whichever result view has focus, and you can rebind them in the shortcuts list:
| Shortcut | Action |
|---|---|
| Ctrl/Cmd+F | Search the result |
| Ctrl/Cmd+C | Copy the focused cell, or the selection |
| Ctrl/Cmd+A | Select every row on the page |
| Ctrl/Cmd+E | Open the focused document for editing |
| Ctrl/Cmd+I | Show or hide the preview drawer |
Tree and Table
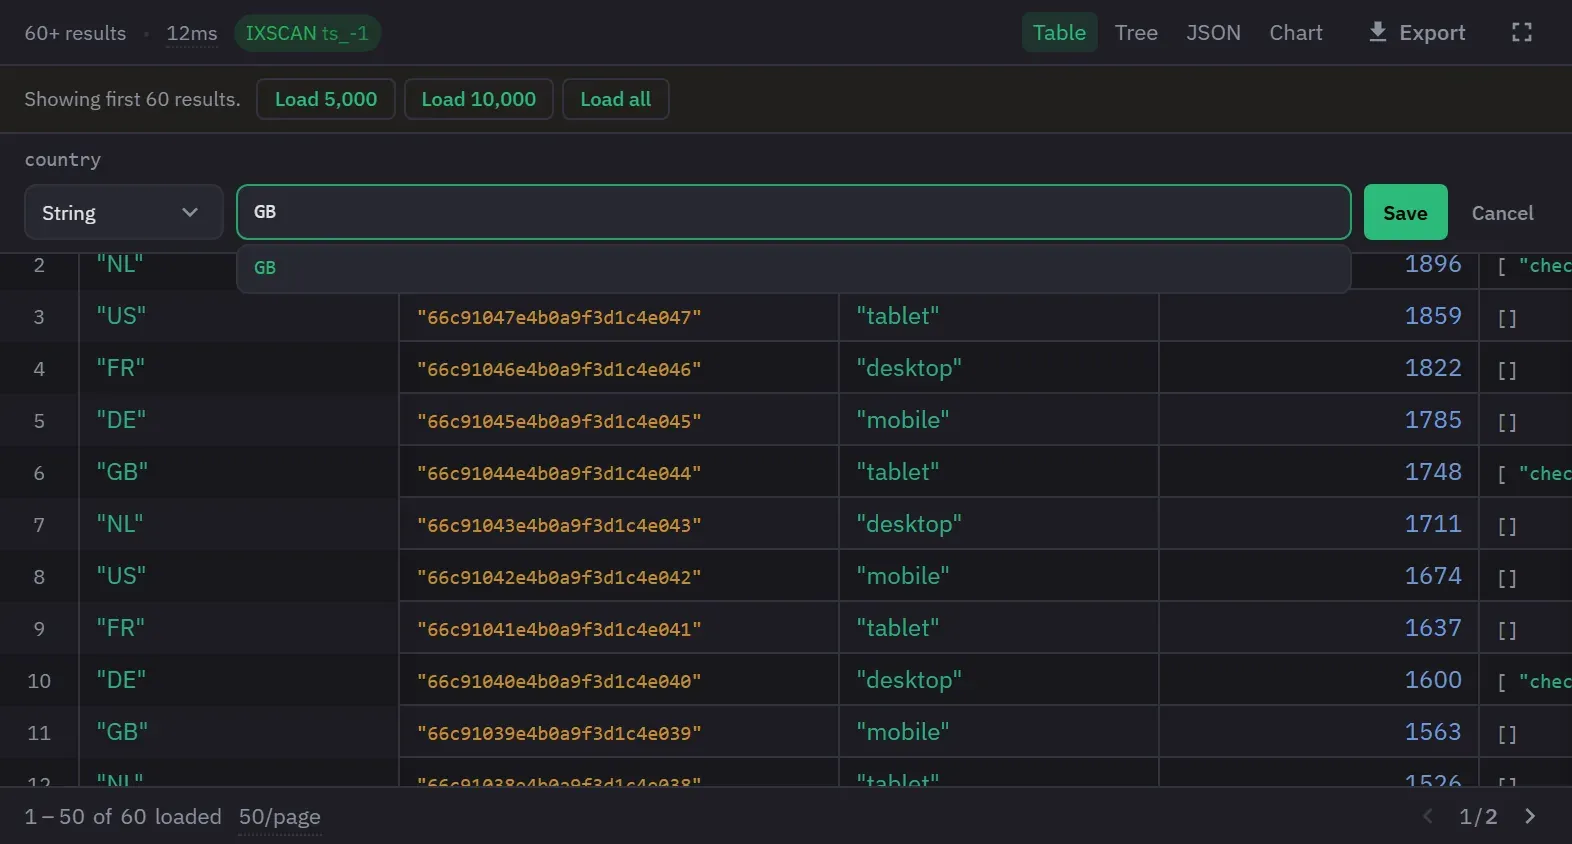
Tree view expands and collapses from the keyboard, badges values with MongoDB-aware types, resizes its columns and keeps document headers sticky. The first three documents of a page open on arrival. Up and Down move the focused row, Right expands it, Left collapses it and Enter toggles it. Shift with Up or Down extends the selection, and Escape clears the selection. A plain click expands or collapses, so only Ctrl/Cmd+click and Shift+click select. Double-click a value that is not an object or array to edit it. Sticky headers stack up to five nesting levels at once, and that setting can be switched off for the whole app.
Table view sorts, resizes, auto-fits, pins and reorders columns, and keeps all of that per tab and
in favorites. The columns are the fields seen on the pages you have visited, with _id first and the
rest in alphabetical order. A field that first appears on a later page joins the table then. A header
identifies the predominant type of its column. A click on a header cycles ascending, descending and
unsorted, and a missing value sorts last either way. Sorting orders only the documents on the
current page. A double-click on a column’s right edge fits the column, and so does Fit Column Width
in the header menu, which also has Pin Column and Unpin Column. A fitted column is never wider than
600 pixels, and no column can be dragged narrower than 60. A pinned column moves only among pinned
columns.
In Table view, arrow keys and Tab move the focused cell, and Home and End jump to the first and last column. Ctrl/Cmd with Home or End also jumps to the first or last row. Enter edits a simple value or expands a complex one, and Space expands. Click selects a row, Ctrl/Cmd+click toggles one, and Shift+click extends the selection. The row-number gutter is also the search toggle.
Hovering an Object or Array cell for a moment opens a read-only preview, which closes on scroll or when the row is expanded. Expanding a complex value inline gives you a nested tree with a breadcrumb path, editable leaves and a resizable panel. It shows 50 children of a level at a time behind a “Show more” control, and it offers the same field and document actions as the grid.
Following a reference
On a database the Database Map has scanned, a column that the map has Verified or Confirmed as a reference names its target in the header, and its cells link to the document they name. The tree view links the same fields, after the value, and the context menu of either view offers Show Referenced Document. See Following a reference from a result.
For a field with no link, the context menu offers one fix, and the link shows as soon as you save it. No new scan is needed.
- A field that the scan found only as a Likely reference offers Confirm Reference to the collection it names. It sets the same verdict as Confirm in the Database Map.
- A field that the map knows nothing about offers Add Relationship…. It opens the Database Map’s Add
Relationship dialog with the collection and the field filled in. The item shows on an ObjectId or a
UUID, and on a string or a whole number under a field named like a reference, such as
customerId,customer_id,productIdsorparentRef. It never shows on_id, or when the result names no collection. - Add Relationship works on a database that was never scanned. When exactly one collection fits the
field’s name, such as
customersforcustomerId, the dialog fills it in as the target. - After the save, a message reports what one check of the values found. It warns when no sampled value matched and when no document has the field, which is what a field made up by an aggregation stage gives.
The interface settings can hide this fix, under Right-click menus.
Searching a result
Ctrl/Cmd+F searches the loaded result set and highlights individual matches in keys, cells and nested values. The match you are on takes a ring in the search colour, so Next moves something you can see. The search is a case-insensitive substring match over keys and values as they are shown. Enter goes to the next match, Shift+Enter to the previous one, and Escape closes the bar and clears the term.
In Tree view, documents without a match are dimmed and held closed, subtrees with a match open by themselves, and the counter reports matching fields or “No matches”. In Table view, rows without a match are dimmed, and the counter reports matching rows. A match inside an object or array preview is marked, and so is a cell whose match is not visible in the form it shows.
Crossing a page boundary moves to the next loaded match. The search does not reach the server and does not fetch past the result cap. A page change that you make by hand clears the term and closes the bar. Sorting a table does the same.
Paging
Pagination applies to Tree, Table and JSON. Result, Explain and Chart show the whole result. The page controls are previous, next and a page indicator that you can type in. A page number outside the range is ignored. There are no first and last buttons, and the controls hide when the result fits on one page. The total count and the range of the current page stay visible.
Page sizes are 10, 25, 50, 100, 200, 500 and 1,000, or any value from 1 to 1,000. A larger number is clamped to 1,000, and a number below 1 is rejected. Changing the page size returns to the first page. The page size persists per tab, and the current page does not.
Result cap
A query without its own limit is capped. Each connection sets the cap as Result Auto-Cap, 1,000
documents by default and 1 to 1,000,000 at most. A .limit() that the query applies, in a cursor
call or in the options object, replaces the cap even when it is larger. A limit in a comment or a
string does not, and a .skip() does not.
A capped result shows its count with a trailing plus, and a bar above the result states how many
documents were loaded. Where the bar does not fit, a capped marker shows beside the count. An
explain result is never marked as capped. The bar offers Load 5,000, Load 10,000 and Load all, and
lists only the choices above the current cap. Load all is always offered. It warns first that a
large collection may be slow, and it has a very large ceiling instead of no limit.
The explain badge
Every read that returns a cursor carries an explain badge: green IXSCAN with the index name, or red COLLSCAN, with the full plan on hover. Hover the badge to see the scan type, the index name, the documents scanned, the index keys examined when not zero, and the documents returned. Hover the timing to see connection time, query time, server time and the total.
Statistics come from running the query a second time, which is why a possible write is never
explained. The app skips the statistics for multi-statement code, for a value that is not a cursor,
for a query that explains itself, for a pipeline with $out or $merge, and when the connection’s
auto-explain setting is off. Auto-explain is on by default. When collecting fails, the statistics
are left out and the result is not changed.
An empty result set still shows its timing and explain information.
The Explain view
The Explain view shows a plan from the toolbar’s Explain button or from code that calls explain. It grades the plan, reports the documents examined against the documents returned, lists each stage with its counts, and warns about collection scans, in-memory sorts and disk spills. It can suggest an index and prefill the Create Index flow. An aggregation also shows the document flow stage by stage. The JSON view beside it holds the raw plan. See Reading an explain plan for the four grades and what they mean.