Reading an explain plan
What the four plan grades mean, why examined-against-returned is the number that decides, and when a collection scan is fine.
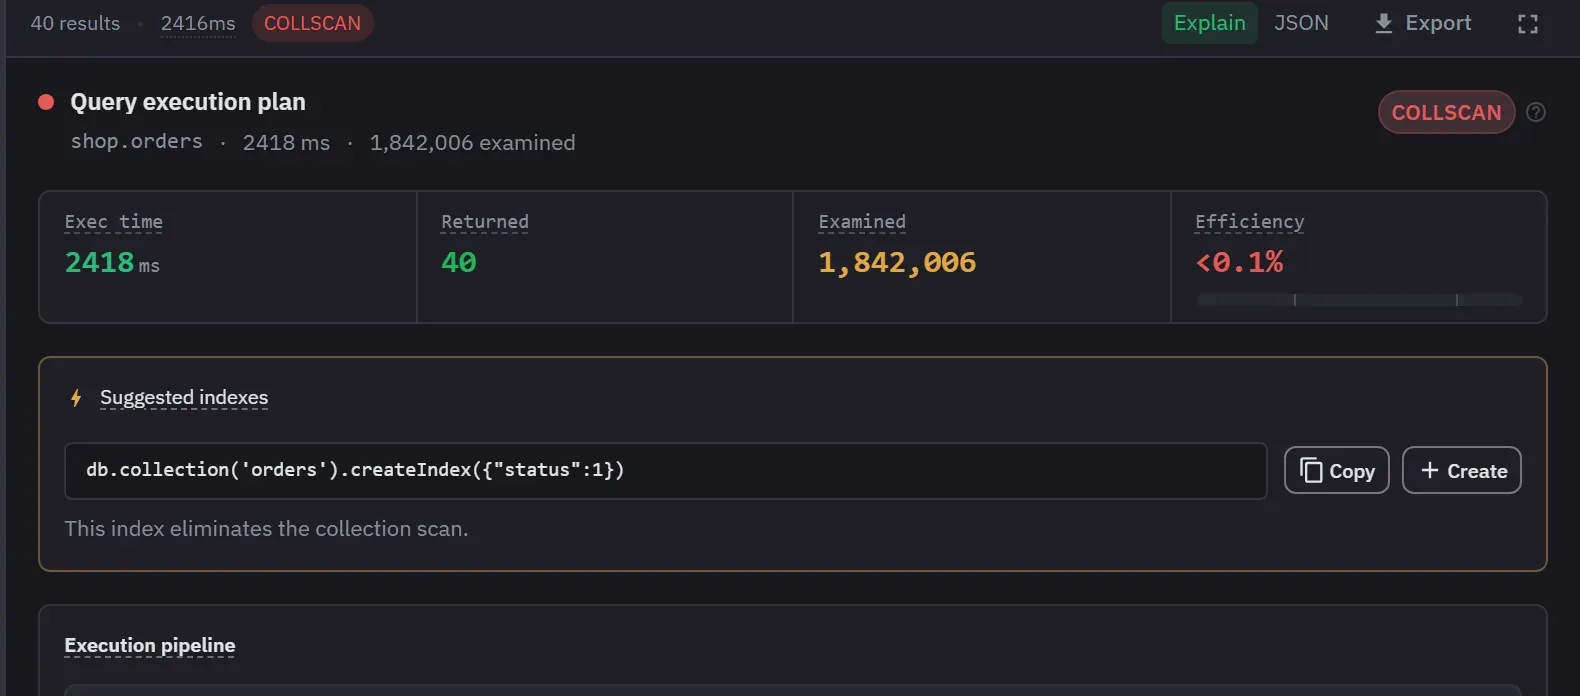
The Explain view turns the server’s execution statistics into a plan tree with a grade on it. The grade exists so you do not have to read raw explain output to answer one question: is this query going to be a problem?
The four grades
A plan is graded as one of four, and each explains itself on hover. The grade appears as a label at the top of the Explain view.
| Label | What it means |
|---|---|
| COLLSCAN | The plan contains a collection scan, so every document in the collection was read |
| Optimal | An index was used and at least half the examined documents were returned |
| Indexed | An index was used, but fewer than half the examined documents were returned |
| OK | The plan has no collection scan and no index scan, or the explain carried no execution statistics. Monghoul has nothing to grade. |
A plan that holds both a collection scan and an index scan is labelled COLLSCAN. The grade counts
an IXSCAN or an _id lookup as an index scan.
The line between Indexed and Optimal is the useful one. An index that is used but not selective still reads far more than it returns, and that is the query that works now and does not later.
The number the grades are about
Documents examined against documents returned. The summary band reports execution time, returned, examined, and an efficiency percentage, on a bar. The bar has marks at 30 percent and at 80 percent. Below 30 percent is poor and usually means a missing or poorly matched index. From 30 to 80 percent is fair. Above 80 percent is good. A number the explain does not carry is left out, not shown as zero.
Examining 1.8 million documents to return 40 is under 0.1 percent. That is the shape of query that is fine on a laptop with 500 documents and takes the site down two quarters later.
An ideal query examines about as many documents as it returns. Getting close usually means one index.
The stages you will see
Each stage names itself, explains in plain language what it does, and reports its returned, document and key counts, its direction, its estimated time, and where present the index bounds it scans and any residual filter it applies.
The one people miss is a sort that happens in memory. A query can use an index to find its documents and still sort them afterwards, and an in-memory sort has a server-side limit it will eventually hit in production. A compound index covering the filter and the sort removes it.
For an aggregation, the view adds a data-flow chart of how the document count changes from the scan
through each stage, on a logarithmic scale so an order-of-magnitude drop stays visible. Nested
pipelines inside $facet, $unionWith, $lookup and $graphLookup are listed as their own
blocks.
When a collection scan is fine
The grade is a heuristic, not a verdict.
- The collection is small and will stay small. Scanning 200 configuration documents is cheaper than maintaining an index on them.
- You are returning most of the collection anyway. If the query matches 90 percent of documents, an index adds work rather than removing it.
- It is a one-off. An ad-hoc query during an incident does not need an index.
What a collection scan should never be is a surprise on a collection that grows.
Suggested indexes
When an index would remove the scan, Explain writes the createIndex call. Copy it, or press
Create to open the Create Index dialog with the fields filled in. Explain offers a suggestion
for the queried collection only when the plan has a collection scan or an in-memory sort. It does
not suggest an index that already exists.
Read it before you accept. The suggestion comes from this one query, and every index costs write throughput and disk on every insert. Index management shows which of your existing indexes are never used, and dropping one of those is often a bigger win than adding another.
Without installing anything
The explain visualizer takes a plan pasted from mongosh, Compass or
anywhere else and renders the same tree in your browser. Nothing is uploaded.