Run your first query
Open a collection, run a find, read the result six different ways, and find out whether it used an index.
Open a collection
Double-click a collection in the sidebar. That opens a query tab bound to that connection and
database, with a find already written for you.
A tab has a connection and a database selector above the editor. A query cannot run until both are set. Change them to run the same code somewhere else.
Ctrl+K (Cmd+K on macOS) opens the command palette, which searches every connection, database,
and collection at once. Start the text with > for commands, @ for collections or # for
databases. It is usually faster than the tree once you know what you are looking for.
Write the query
The editor is Monaco, running against the MongoDB Node driver, so the syntax is the syntax you already know:
db.orders.find({ status: { $ne: 'cancelled' } }).sort({ placedAt: -1 })Field completions come from your actual collection schemas. Monghoul learns a schema by sampling
documents, and it does this in the background unless you turn off Auto schema analysis in
Settings. A connection can override that setting. A collection it has not sampled yet has no field completions. Type a field name and you get its real
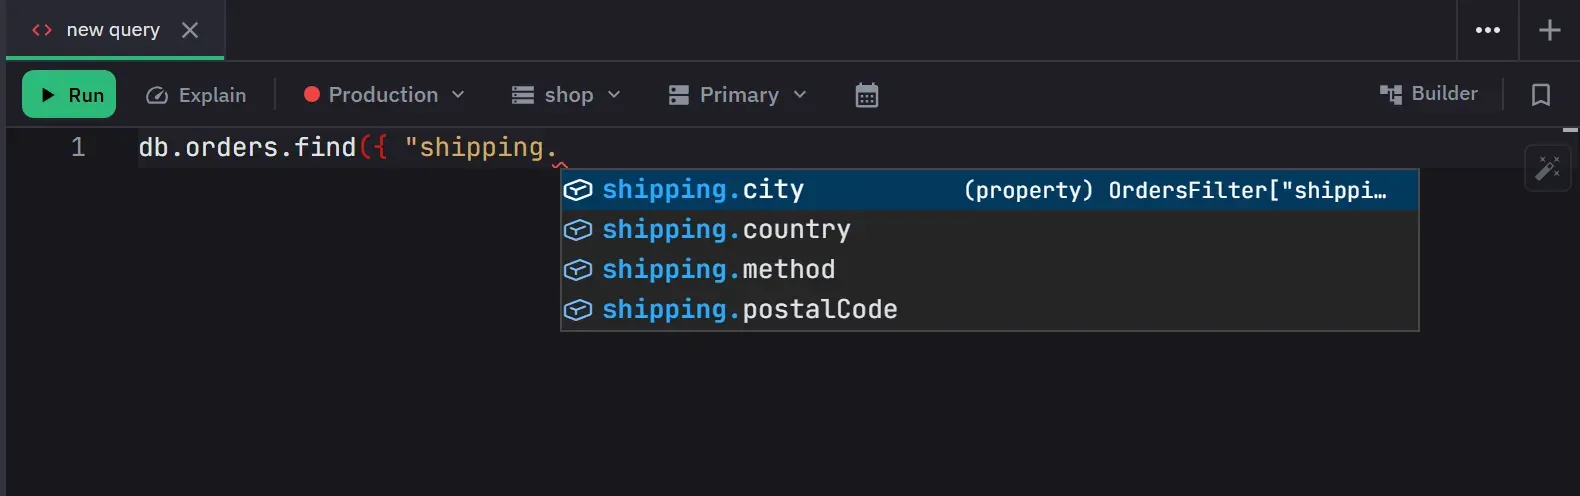
BSON type; type address. and you get the child fields under it. In a filter, typing address also
offers the nested paths such as address.city, and a string after $ne offers the values the field
actually holds, such as the statuses in your orders.
The part worth knowing about is what happens inside a pipeline. The editor folds the pipeline
stage by stage: $project, $group, $count, $facet, $bucket and $unset reshape the result,
and $addFields, $set and $lookup add to it. A field introduced by an earlier stage is still
offered to you eight stages later. Where a stage’s output cannot be derived, the whole document is
kept rather than guessed at, so valid code is never reported as an error. Schema-aware autocomplete has
the full behaviour.
Run it with Ctrl+Enter (Cmd+Enter on macOS). While a query runs, the Run button becomes Stop.
A query that passes the connection timeout, 30 seconds by default, is stopped on the server too.
Queries and Markdown notes autosave, and Ctrl+Shift+T (Cmd+Shift+T) brings back a tab you closed
by accident, with its text.
A query without its own .limit() returns at most 1,000 documents. A bar above the result says when
the result was cut. Raise the limit with .limit(), or change Result Auto-Cap on the Advanced
tab of the connection.
Read the result
The result pane has six views, and the one you want depends on the question:
| View | Use it for |
|---|---|
| Table | Scanning many documents with the same shape |
| Tree | One document at a time, with the BSON type of every value |
| JSON | Copying the raw Extended JSON out |
| Result | A write outcome, or a single value |
| Explain | Whether the query used an index, and how efficiently |
| Chart | Seeing the shape of the numbers (Pro) |
The buttons above the result offer only the views that fit it. A list of documents gets Table,
Tree, JSON and Chart, a write outcome gets Result and JSON, and an explain gets Explain and JSON.
Ctrl+I opens a preview drawer that follows the focused row.
Check that it used an index
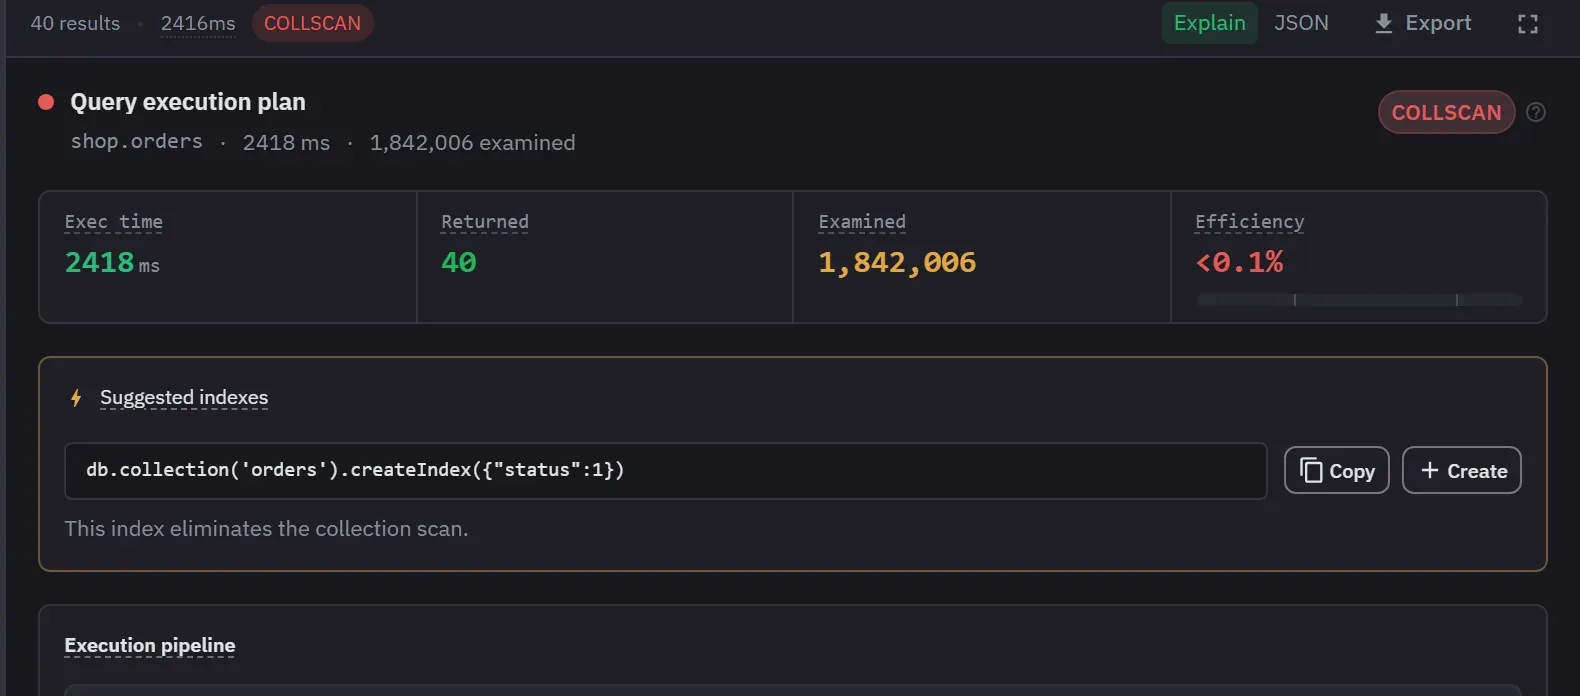
This is the habit worth forming early. Auto-explain runs a read a second time to collect its plan
statistics, so the result reports its scan type without you running explain yourself. The badge
next to the result count reads COLLSCAN for a full scan, or IXSCAN with the index name for an
index. Hovering it details the plan: scan type, index name, documents scanned, and documents
returned.
Auto-explain covers a find or an aggregation written as one expression. It skips a script with
several statements, code that calls explain itself, and a pipeline with $out or $merge. It is
on by default, and the Auto-explain switch on the Advanced tab of the connection turns it off.
If you see no badge, check those cases.
If it scanned the collection, click Explain in the toolbar. The Explain view grades the plan COLLSCAN, Indexed, Optimal or OK, lists the plan stage by stage, and suggests the index that would remove the scan. Its Create button opens the Create Index dialog with that index filled in.
You can also paste an explain plan from anywhere else into the explain visualizer, which runs in the browser with nothing installed.
Next
- Query editor and environment for the JavaScript sandbox
- Result views for everything the result pane does
- Reading an explain plan for what the grade actually measures